

For quite some time now, there’s been a debate about whether the US market is a bubble or not. We will discuss here the indicators where you yourself can decide on the current market state of the US economy. We will no longer need to point it out for you, you will know it after reading this article.
There are several indicators, let us discuss some of these:
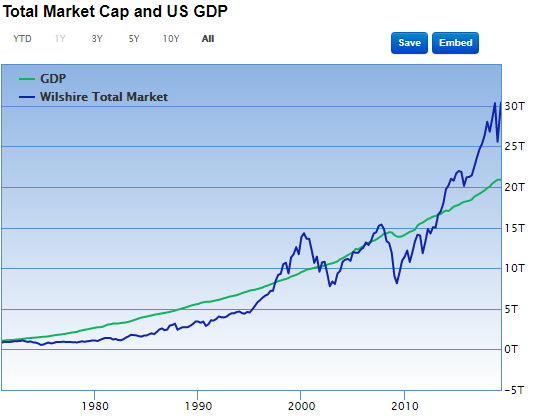
- The Stock Market Capitalization-to GDP Ratio – otherwise known as the Buffett indicator, this ratio, according to Investopedia is used to determine whether the current stock market is overvalued or undervalued as compared to the historical average. It was popularized by Warren Buffet when he said that “it was probably the best single measure of where valuations stand at any given moment.” The formula is simple, divide the stock market cap by the GDP:
Stock Market Cap / Gross Domestic Product
The stock market cap refers to all the publicly traded stocks in the market while the GDP is the last reported quarterly economic gross domestic product. Most analysts use the Wilshire 5000 total market index, an index representing the value of all stocks in the U.S. markets.
Below are the percentages and what they could tell us about our stock market:
Greater than 100% – overvalued
Around 50% – undervalued
50% to 75% – modestly undervalued
50% to 90% – at fair value
90% to 115% – modestly overvalued
According to Gurufocus, as of April 30, 2019, the Total Market Index is at $ 30371.1 billion, which is about 145.6% of the last reported GDP. This means that the stock market is currently and significantly overvalued. This is more than 30% higher than the ratio before the start of the Great Recession.
Below is the chart from Gurufocus:
- Household Networth to GDP – this is calculated by dividing the current bubbles in the equities and home prices which currently is inflated by the interest rates. Currently, the percentage is at a whopping 535%. This inflated bubble is 19% higher than the DOT-com bubble in 2000 and 41% higher than the historical average of 379%.
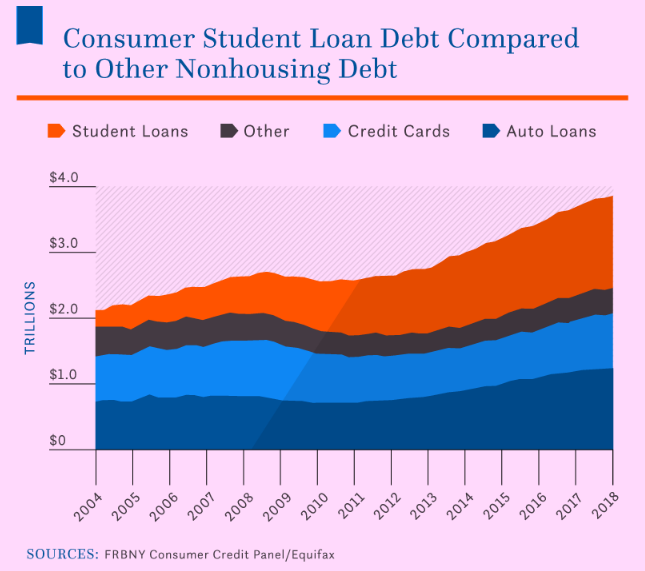
- Student Loan – Student loan is in crisis with the numbers at $1.5 trillion this year, the highest ever. Currently occupying the 2nd spot in the debt category, surpassing both the credit cards and auto loan and just behind the mortgage loan.
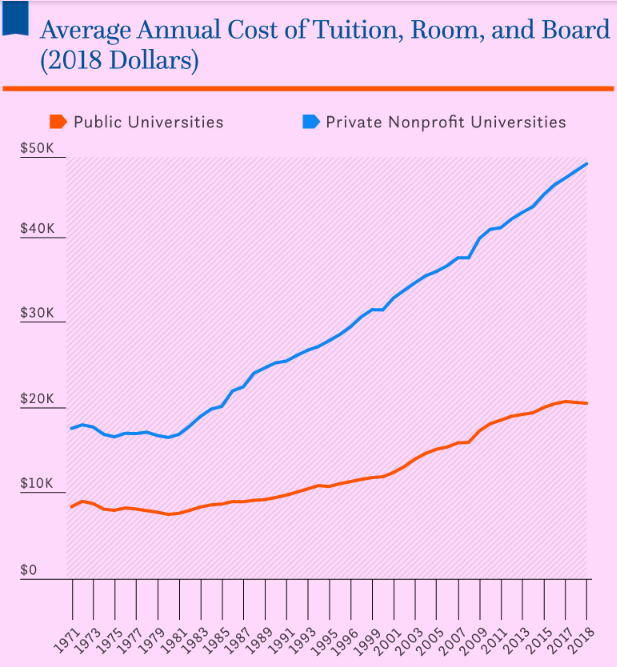
Since it’s the federal government who will bear the risk at default, the colleges increase their tuition fee with freedom. The chart below from collegeboard.org
- Federal Deficit soaring high – The federal deficit ballooned during the first four months of the fiscal year. It went up 77% as the total deficit totaled to $310 billion from $179 billion in the same period last year according to the Treasury Department. The department cited falling tax revenue and higher spending as the reasons for this outrageous increase.
Just as former Senate Budget Committee chairman Kent Conrad (D-N.D.) said: “It’s big tax cuts combined with big increases in spending when they already had big deficits, So guess what, it’s craziness!“.
Tax revenue from Oct 2018 to Jan 2019 fell by $19 billion or 2% with the corporate tax payments falling by 25% or 17 billion in dollars largely as a result of the 2017 tax cut law from 35 to 21%.
And while there were significant decreases in the tax collection, the government’s spending went up by 9%. Major contributors to the increase are the defense by 12% and Medicare by 16%.
If the market is overvalued while people and the government are having debts from here and there, then why is the asset prices at an all-time high? The US GDP growth currently has slowed down to almost half while Japan’s is next to none same with Europe but assets are high because of:
- Zero Interest Rate Policy or at times the Negative Interest Rate Policy – The zero interest rate policy was increasingly used by central banks worldwide after the 2008 economic crisis to combat deflation. Deflation happens when people start to hoard cash instead of spending it causing smaller profits and slower economic growth. By reducing the interest rates, the consumers are encouraged to spend more and the businesses to raise prices. In cases where zero interest rate policy doesn’t work, the central banks will lower the interest rates more into the negative territory.
In 2014, the European Central Bank introduced the negative interest rate policy and in 2016, Japan did the same to stimulate its economy and overcome persistent deflationary pressures. While the objective is all good, it resulted in a massive consumption recording new highs of debts which in turn inflates the asset prices.
After Seven Months into the Pandemic
Gold continuously moves higher in the past months and [...]
Wirex joins MasterCard Crypto Program
Cryptocurrency is here to stay. The banks know about [...]


