
Broken Wing Butterfly
Example in

For EDUCATIONAL PURPOSES ONLY!
Prologue
Though you do not have to read the Random Walk BWB (Level 2 – Option Trading Guide to Broken Wing Butterfly (BWB) text to understand the material below, you will most likely not understand most of the concepts and reasons for executing the trade at the chosen location, the chosen expiration date, and how the trade was managed. This material is meant simply to be an extension of the current BWB text, so please refer back to your classic and indispensable text to refresh yourself on why certain strikes, quantities, and expiration dates were chosen.
Introduction
Those who read the Random Walk text Level 2 – Option Trading Guide to Broken Wing Butterfly (BWB) – the BWB text, often go out and try to replicate the trade. After 1, 2 or 5 attempts, they get frustrated and quit the strategy because the markets didn’t cooperate and the spread expired worthless. In our Practical Option Trading class we recently did several BWBs as the markets dropped and volatility increased. We were not sure when or if the markets would bounce. When they did bounce one BWB was in a location that took advantage of the sudden rebound higher in the markets.
This write-up illustrates an example where things worked out about as good as one could hope without being exceptionally clairvoyant about the closing price of the index at some point in the future. Even though it is a great example, it is NOT indicative of how most BWBs work out since it does happen several times a year for some people who trade a lot of BWBs.
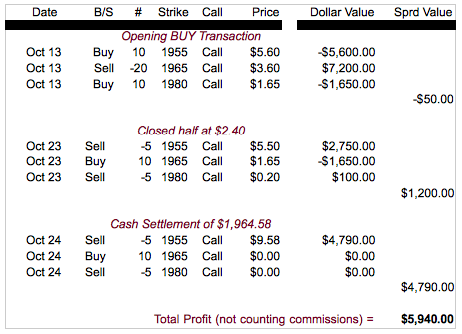
The paper trade fill prices are at the bottom of the sheet. You will notice that there are three (3) orders. The first order was the trade that was executed to get long 10 contracts of the trade. The second order shows what selling half of the trade out for a small profit could look like. The last order was NOT an actual order as we let the trade expire into cash at the close of Friday, October 24th. Because we did nothing but watch the cash underlying move around, no actual order was needed. This order is simply being included to show people what a closing order would look like had we not let the settlement remove the position.
As you explore this example, you will see an index underlying chart that hopefully gives you a better understanding of what was occurring in the markets at the time. The market was extremely volatile and most other strategies would have been very unnerving for many traders. This was a great strategy to have in place during these turbulent times.
Material
Market Conditions During the Trade
The following chart of the SPX cash shows the huge swings taking place when the original opening order was placed and executed. Notice that on October 10th, the SPX cash was at about 1970, and on October 13th, the cash was at about 1875. This $95 point drop was about a 5% drop in just a few days. As a matter of fact, the markets had fallen from a high to a low of about 9% in just a couple weeks. You will also notice that the markets had bounced all the way back to the starting point by October 24. Many analysts said we were going to drop >30%, and others who were bullish days before started to retract their opinions and statements – all of which caused the markets to go nuts.
Anyone suggesting that they could have picked the closing price of the index 2 weeks forward in time had to be dismissed as a fool. We were moving 2% a day many times during this period.
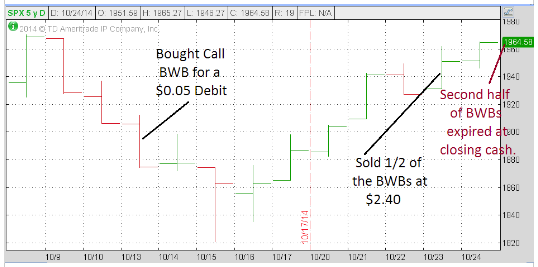
BWB Open – October 13th
Knowing that a BWB’s spreads favor being executed during periods of high volatility, we elected to place a few of these type of trades during this volatile time period. The SPX cash on October 13th closed down 31.39 at $1,874.74. This was down 1.7% on this day alone. To give you more perspective of how the markets were moving at the time, the VIX closed that day on a 24.64% volatility level.
This type of rapidly declining market can be one of great opportunity. Yet many traders fear “bottom fishing” to place a bullish position because being a day or two early can be financially devastating for a call buyer or put seller. This is why the purchase of the BWB was so appealing.
The short term option expiration fill prices below reveal that prices were through the roof at the time. The 1955 call (see below) was filled at $5.60 when the cash was as much as $80 OTM that day. This equates to 4.3% away from being ATM.

Thinking
Here is a trade (long 1955-1965-1980 call BWB) that was a great deal OTM and roughly at an area we deemed as resistance to the upside. A rapid bounce back higher (as eventually occurred) would still be safe given that the cash was $80 OTM from the first long strike (1955). The center strike (1965) was $90 OTM, and the break-even point (1975) was $100 OTM.
BWB – Closing Half
On the day prior to Friday’s October 24th expiration, the SPX cash was close to the sweet spot of 1965. The cash had gotten up to $1962, but then fell down to close at $1,950.82.
Here is the dilemma….
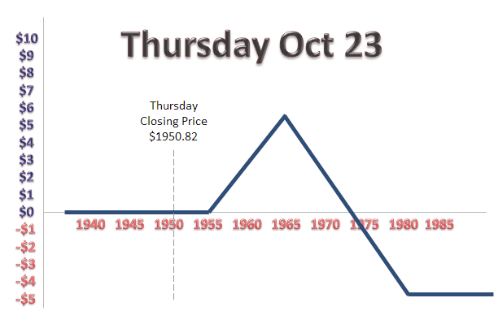
We know that the BWB is worth the most when at the center strike (1965 in this particular example) and at the moment of expiration (tomorrow).
Three things can happen tomorrow followed by a wide subcategory of those three things.
Move Lower
If the markets move lower the entire spread will expire worthless the next day. Whatever the trade is going for now will seem like a generous price compared to what a falling market will do to the price. This is the first reason why I decided to sell half of the spread out on Thursday.
Stay Unchanged
If the market opens the next day (Friday) unchanged, the spread will likely stay at about the same price as it closed, and it might even open a little higher because one day of time decay has passed. Yet as the market stays unchanged throughout the day, the spread will decrease in value.
On Thursday, the spread was trading for $2.40. For the spread to be worth $2.40 on Friday’s close, the market would have to be at $1,957.40 (1955 strike + $2.40). Since the market closed at $1950.82, the SPX cash would have to be up $6.58 on the close to replicate the current value of the spread.
Move Higher
The market can also move higher, and that is what this position needs. But there is no guarantee that this is going to happen. If the market has been up 6 days in a row, what are the odds that it will be up for a 7th day just to help you with your position? We saw above that a move of $6.58 higher would give the spread enough intrinsic value on expiration to replicate the value of the spread today. A rise of less than $6.58 would give us a smaller return.
Decision
The best thing to do would be to sell half of the position at $2.40. Selling 5 contracts at $2.40 would bring in $1,200, which is not bad considering that the spread cost $50. If the market opened down big the next day and the spread went close to $0, that would not be fun, but it would not be the end of the world.
If the market opened unchanged the next day, I would have time to make a decision to sell out the other half or let it run for the day. Since it was likely to be trading at about the same price if the market opened Friday unchanged, selling half of the position would cause no harm. I could even buy back the 5 contracts if I was emotionally attached to them and wanted them back.
If the market opened slightly higher, I was going to be in a good position, but if the market opened up by a large amount, the value of the butterfly could actually decline from the $2.40 value because of the risk to the upside above $1,975. So selling out half today would allow me breathing room of $1,200 to absorb against the small potential for loss should the market close above 1980 (maximum loss area).
On 5 contracts of this BWB, I would have about $2,500 of risk ($5 short spread X 5 contracts). With $1,200 in my pocket already, my maximum risk comes down to $1,300. Thus, selling half of the trade out now would not be a negative even if the market went higher.
Enter Closing Position
So I entered an order (as seen below) to sell half of the spread at $2.35 and was filled slightly better at $2.40.

BWB – Friday – Second Half of Spread
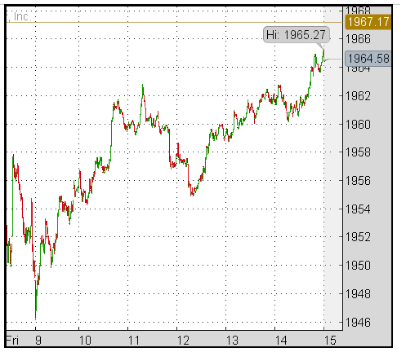
The market opened uneventful Friday morning.
The market opened slightly higher and then sold off to be down slightly all in the first 30 minutes. After that, things were very slow and boring all day with the SPX cash moving slowly higher. From 10:00 am central time (11:00 eastern), the market was above the first long strike of the BWB – the 1955 strike.
For the first 2-3 hours of the day, the BWB was showing a market price of the same $2.40 it was trading at the previous day (Thursday). After roughly 1:00 pm, the spread started to increase in value as the market slowly climbed higher and time until expiration approached. The next sticky pot for the spread was about $3.60.
I sent an order into the trading pits to sell the last 5 contracts at $7.00. My thinking was as follows:
- First, there was no way the traders would want to buy this from me at $10 at any time of the day since the most the spread could be worth was $10.
- Even if the market was looking close to the sweet spot of $1,965 for the entire day, no one was going to pay anything close to $10 as cash in the SPX could move $5 in the last 5 minutes of trading as “market on close” orders came to fruition (to buy or sell).
- But $7.00 may be a trade-worthy price for traders willing to gamble on the closing market. They could still take $3 out of the trade if they got lucky and I didn’t want to be in the business of counting on luck for a profit.
About an hour before the close, I got the sense that the market was not going to sell off in the last hour. Given that the cash was near 1962 (a place that would make the spread worth $7 on the close) I was in no worse of a position if I canceled my order and took my chances. Even if the market went past my 1965 sweet spot to 1968, I would have still made at least the same $7 I was trying to get on the second closing order. I decided to cancel the order and try to make more than $7.

Above you see an order that was NOT in the pits, but was in my head. I was going to let the last 5 contracts close where they may, or quickly enter a closing order to make what I could on the remaining 5 spreads.
As I stated moments earlier, experience sometimes gives a trader a little edge over the rest of the world, and I felt that there was strong (albeit slow and steady) buying taking place.
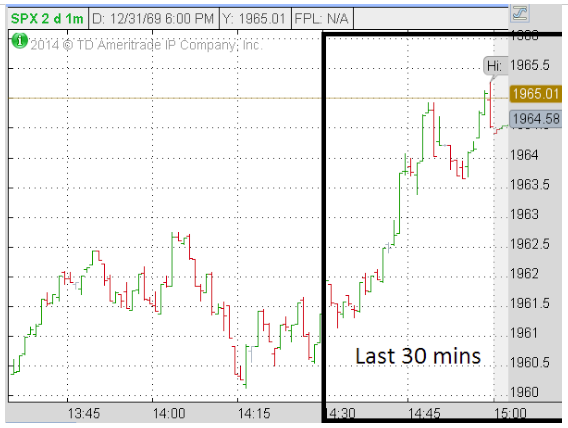
At 2:30pm central time (the last 30 minutes), cash was at 1961.50. If the market closed at that exact spot, the spread would see the long 1955 call trading for $6.50. All the other option strikes would be OTM; therefore, the spread would be worth $6.50. Trying to sell the spread at $7 would be a good trade, but if we got a little squirt higher, I could make a lot more. This is why I canceled the order and let the spread run, but I also never took my eye off of things.
3:01 central (4:01eastern) – Market Closed
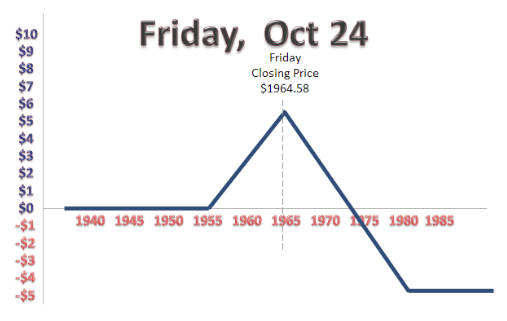
The cash markets closed at 3:01 pm central time with the SPX cash settling at $1,964.58. You can see how there were obviously people buying stocks in the last 30 minutes of trading as the SPX cash moved from $1,961.50 to $1,964.58 (a $4.08 move higher). Those who do not trade SPX may feel that a $4 move in 30 minutes is a large move, but it only equated to about 25 Dow points.
CASH Settlement
Since the SPX settles into cash (not stock), leaving this spread run into the close poses no risk other than being wrong. And once in a while people get lucky in the markets. Below you can see that the SPX cash closed at $1,964.58, or $0.42 cents away from maximum profit. The last 5 contracts were worth $9.58 X 5 contracts, or $4,790 (not taking the $0.05 cost into consideration).
Not bad !
Yes, this was a great trade, but the novice often gets bogged down with regret at having sold half of the trade at $2.40 the previous day. They will play a broken record in their head saying, “Had I not sold the first half on Thursday, I would have made $9.53 ($9.58 minus the $0.05 cost).” And though these hindsight thoughts would be correct, they do not consider trading as a long term proposition. This time we got lucky. The next time, the markets may open down BIG and half the spread we could have sold at $2.40 (but didn’t because of greed) may open Friday at $0.10. We are in this for the long haul.
The Final Accounting Is As Follows:
MAJOR LESSON:
Look at the prices of the options on the day the trade was entered and the day the first half of the trade was closed (Oct 23) in the above table.
1955 strike
If you look the price of this strike when the trade was placed, you will see that the 1955 call was trading for $5.60. Yet 11 days later, the call was trading for almost the same price – at $5.50.
1965 strike
On Oct 13, the day the trade was executed, the 1965 call was sold at $3.60 (twice as many times as it was purchased). Ten days later, the calls were trading at $1.65, or $1.95 lower. You can look at this and imagine how the normal distribution curve was shrinking because of lower volatility and fewer trading days remaining.
1980 strike
The same phenomenon that was taking place with the 1965 strike (shrinking of the normal distribution curve) was occurring at this 1980 strike, but even more so (because it was further OTM).
Closing
Studying these prices will give you a better and very real understanding of how a great BWB looks, acts, and trades. We hope this little BONUS material helps those people who are struggling with the BWB spread (or I could have spent the weekend sleeping instead of writing this).
Cheers to more spreads like this in the future.
Thank you!
DISCLAIMER
For education purposes ONLY. Please read all disclaimers on our website. We do not care if you agree or disagree with it – that is the rule. All data contained is provided for informational purposes only. Random Walk makes no guarantee as to the accuracy of the data. Do NOT trade based on any of the things we discussed. Random Walk does NOT give advice. Any trade examples contained are simply to illustrate how a strategy can work – good or bad. All trade examples are done in a “paper trade” account in order to comply with local, state and federal laws. Please be cognizant of the differences between a paper trade and an actual trade executed in the trading pits. Random Walk insists that no one copies any trade being done.
This is NOT meant to be advice. All trade examples are for illustration purposes and are done in a paper trade account to comply with the laws of the land. Random Walk DOES NOT guarantee the accuracy of anything, especially data we get off of various websites. This can affect returns compared to a regular account. We are not a broker, investment adviser, tax specialist, shoe repair company, or any other highly skilled group of individuals. Trading and investing are very difficult, scary and risky. In short, we don’t know the real odds of success for anything, but would guess that one is better off flushing money down the toilet – when it backs up, you will feel like a winner. You are responsible for obeying the laws of where you reside, and those of the United States.