
Straddles & Strangles
 [/ezcol_1third]
 Contents:
- Straddle & Strangle Overview [/ezcol_2third_end]
In chapter 5 we saw that if you were bullish (meaning that you thought the market was going higher), you could purchase a call in an attempt to make money. And if you were bearish (meaning that you thought the market was going lower), you could purchase a put option to profit. But what if you thought the market was going to move in a big way – but you had no idea which direction.
If the market moves up dramatically, then the call will profit while the put expires worthless. Should the market do the reverse, the put will profit and the call will expire worthless. The key is that the markets have to move enough to pay for both the call and the put option since one will expire worthless.
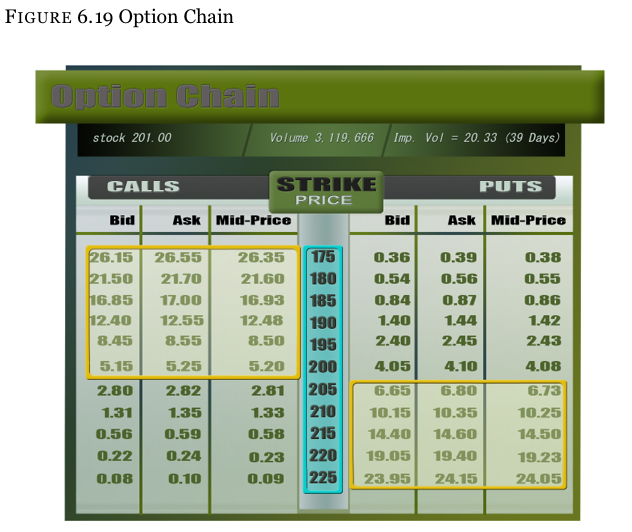
We can use the same option chain from before to learn more about straddles and strangles. We can learn both strategies simultaneously since they are almost the exact same thing.
Request Video of Option Basic Seminar ? Click here
Straddle
Straddle Analogy
The best analogy is also a painful one.
Suppose you were walking along a picket fence and slipped while you had one leg landing on each side of the fence. You could say that you are now “straddling” the fence. And if you could distract yourself from the pain for a moment, you might realize that this is the exact same thing as an option straddle.
A small movement more to the left and the left one ‘gets it’. A small movement a little more to the right and the right one ‘gets it’. Guys know what this would mean. Now think in terms of an option straddle. If the market moves just a tad to the left (down in price), the put option will pick up intrinsic value. If the market moves just a tad to the right (up in price), the call option will be In the money In other words, there is only one place that the straddle will not have intrinsic value, and that is right at the strike price.
[/ezcol_2third]
 [/ezcol_1third_end]
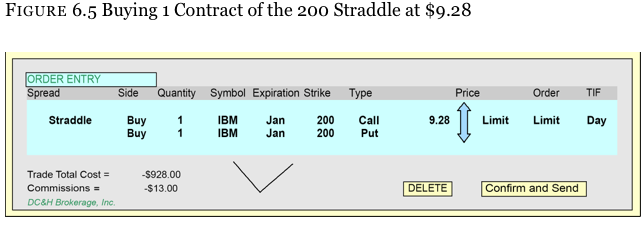
A long straddle is the purchase of both a call and put option which share a common expiry month and strike price – usually done at-the-money.
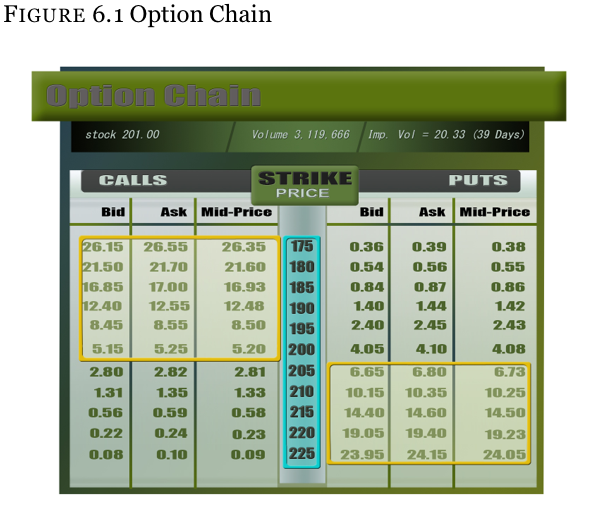
We know that the stock is starting out at $201 and we feel that it is likely to make a large move in one direction, but we do not know which direction it will be.
Call
We will purchase the at-the-money (ATM) 200 strike call for $5.20 should the move be higher.
Put
We will also purchase the at-the-money 200 strike put for $4.08 should the move be lower.
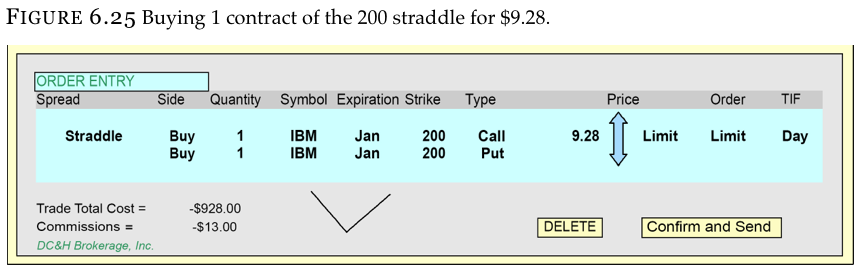
Buying the call for $5.20 and the put for $4.08 results in a long straddle position that costs $9.28 per share ($5.20 + $4.08), or $928 per contract ($9.28 per share X 100 shares per contract).
The cost of this straddle is $9.28 per share which means that the stock has to move to have the call or the put pick up that amount in intrinsic value to at least break-even. Any move greater than $9.28 in either direction makes a huge profit on expiration.
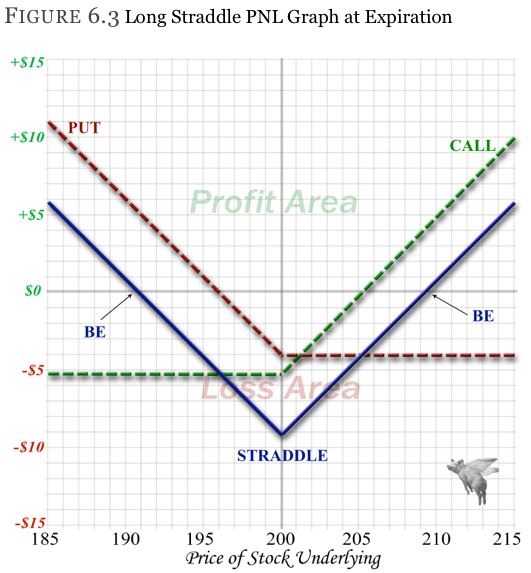
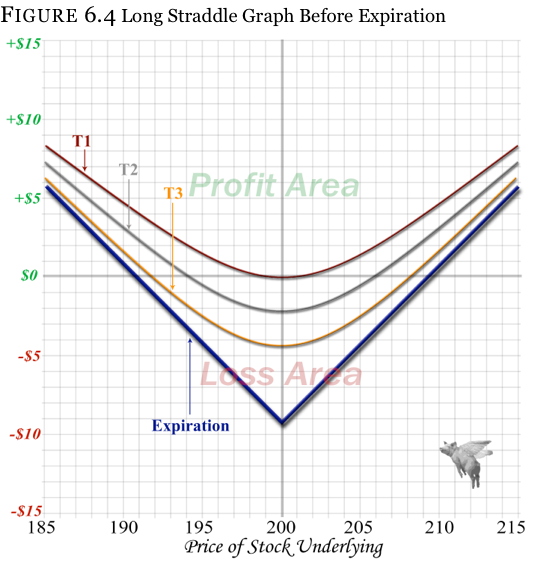
Prior to expiration, the straddle can start making money once the stock moves, but will be fighting against the time decay that takes place every day. If the stock does not move enough to compensate for the time decay, a loss will start and get larger every day. See Figure 6.4
- Time Period 1
The “T1” line on the Figure 6.4 shows the profit and loss of the straddle the moment the trade is put on. If the stock does not move, a profit is neither made nor lost, but once the stock moves you will begin to make a profit. And though it may be tempting to place this trade based on looking at this T1 line, you have to keep in mind that you will be fighting time decay immediately after you place the trade.
- Time Period 2
This is what the profit and loss will look like shortly after the trade has been placed – call it one week later. You will notice that, unlike when the trade was initially placed and the stock did not have to move much to make a profit, the time decay has eaten into the original value of the straddle. The stock has to move a good deal for the trade to even get back to its original purchase price.
- Time Period 3
This line can represent more time elapsing. In this case, we can pretend it is yet another week. Notice that the amount the stock has to move in either direction to break even or make money is even larger now that more time passed.
Entering a straddle is just like entering a naked call or put option trade. There are two differences:
- Two pieces of information will be entered – the call and the put strikes.
- The only price that will be entered is the price of the straddle as a package. When we originally looked at the trade, the call was trading for $5.20 and the put was trading for $4.08. Yet, it doesn’t matter what price each individual option is actually filled at, so long as the combined package that creates the straddle is not priced above $9.28. Many times, you may see the market move the moment you place the trade and end up getting fill prices that could look like $6.01 and $3.27. This does not matter as both prices do not add up to more than $9.28.
These are strategies used by people when they feel that the market is going to move one way or the other in a big way. Here is a short list of some of the items that can precipitate a large move:
- Earnings are approaching
For example, earnings in Apple computer will come out in a few days. If earnings are good, the stock will run higher. If bad, it will fall harder.
- The market is at a large support or resistance number.
The Dow or large stock is at a major number. For example, the Dow is nearing all-time highs of 14,000. Many times the market will retrace after people sell and take profits. Yet, if the stock market goes through this number, it can move fast because the sellers do not exist as anticipated.
- Global economic news is hitting the markets.
For example, Greece is going to default on loans and it could send shock-waves throughout the European region. If Greece defaults, the whole European community could take a big financial loss (as they lend to Greece). Yet, if Greece’s neighbors offer a quick and substantially real fix, then a relief run higher could result from fear of the worst evaporating.
For those expecting a large move, it is hard to beat a straddle or strangle, especially if the move is down and volatility is increasing. (Remember from the section on the greeks that you are long
- Dollars
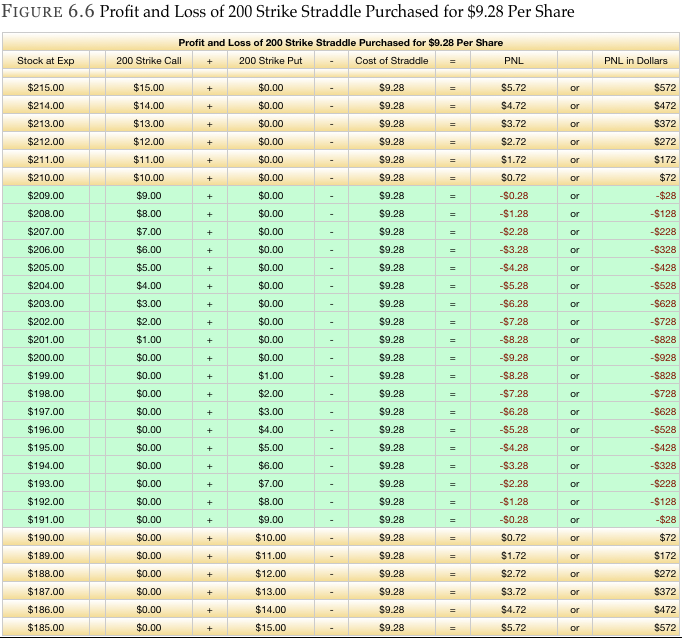
Many people understand the straddle better when they see how the position reacts through a given set of stock prices.
Figure 6.6 is the 200 strike straddle (200 call and 200 put) purchased for $9.28 as seen through a $30 range in the stock at expiration (no time value left).
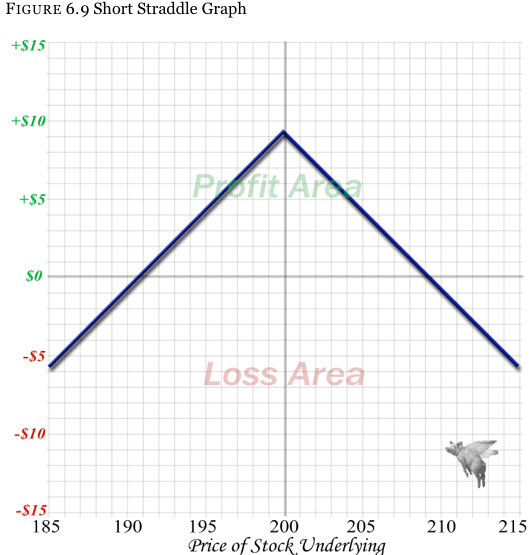
Just as for every buyer of a call or put option there is a corresponding seller, the same applies for a straddle. You would sell a straddle to take advantage of markets that are trying on exceptionally high volatility (thus the options are very expensive) and/or because you feel that the markets will not be moving any time soon.
With the straddle we want to purchase for $9.28, we know that the stock has to move more than $9.28 above or below $200 a share to make a profit. A loss will occur with anything less than $9.28 stock movement by expiration.
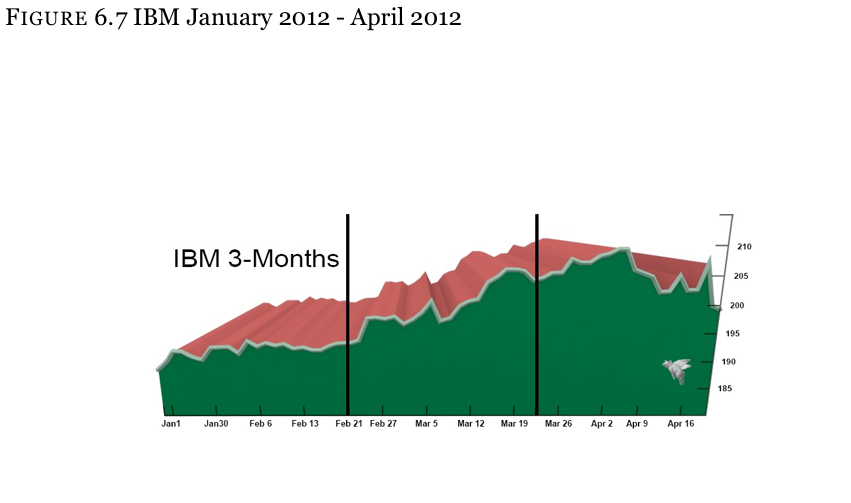
Looking at a 3 month chart of the stock in Figure 6.7, it is easy to see why one may be tempted to sell the straddle at $9.28. If the stock does not move up or down by more than the straddle’s sale price, then a profit will result.
Looking at Figure 6.7 in the most recent month of movement (far right side of the graph), we see that the stock started at about $205 and ended at about $200 for roughly a $5 move. In the month before that (in the middle of the chart), the stock started at roughly $193 and ended at roughly $205, thus having a $12 move. Finally, in the first month (far left side of the chart), the stock started at $188 and ended at $193 for a $5 move again.
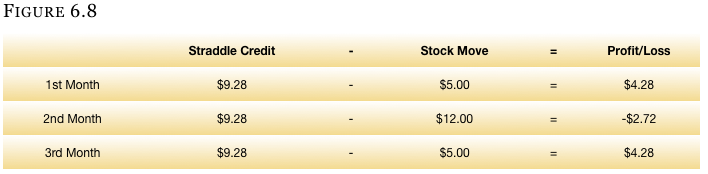
So if you had sold a straddle every month at $9.28, you would have made money for two of the three months as Figure 6.8:
Although selling an option did not seem logical at first, there is never a shortage of people willing to take either side of any trade provided the price is realistic. Figure 6.9 is the graph of a 200 strike straddle sold at $9.28(at the expiration)
Request Video of Option Basic Seminar ? Click here
[ezcol_1third] [/ezcol_1third] [ezcol_2third_end]
Strangle Analogy
You can think of a trading strangle in terms of an actual strangle. When you are strangling someone, you will place one hand on one side of his neck, and one hand on the other side of his neck. No matter how hard you squeeze, your palms will never meet.
The same holds true with an option strangle. You will place an option on one side of the stock and another option on the other side of the stock.
We just went over the basics of a straddle and how they react to stock movement and time decay. The strangle will be very easy to understand since it is almost the same strategy as the straddle.
The best way to understand a strangle is to compare it to the definition of a straddle.
[/ezcol_2third_end]
Straddle Definition
A long straddle is the purchase of both a call and put option which share a common expiry month and strike price – usually done at-the-money.
Strangle Definition
A long strangle is the purchase of both a call and a put option which share a common expiry month – BUT a different strike price. Both options are usually out-of-the-money.
The only difference between a straddle and a strangle is the selection of the strike prices. The straddle will always share a common strike price, while the strangle has two different strike prices.
With the stock trading at $201, we previously chose to purchase the 200 strike straddle – the 200 strike call and the 200 strike put. Knowing that the call gives the owner the right to buy the stock at $200 per share when the actual stock is at $201 gives this call $1 of intrinsic value. Therefore, when we purchased this straddle, the only way for us not to be purchasing intrinsic value is to buy the straddle when the stock is at exactly $200. Yet this is usually not a possibility.
Waiting for the stock to go down $1 to $200 per share so that we can purchase the straddle without having to buy intrinsic value may cause us to miss the trade and we might have to wait as the stock moves to $205. In that case, we would have missed out on making money on the 200 straddle.
Instead of waiting to buy the straddle when the stock gets down to $200 even per share, we can move the call strike up from the 200 strike to the 205 strike. This is the first strike that is out-of-the-money, and doesn’t have intrinsic value in it.
Think of it as leapfrogging the ITM call to the next strike higher. If it was the put that was ITM, then one would leapfrog the put down and further OTM. The image below is of the 200 strike straddle where the 200 strike call gets moved out to the 205 strike.
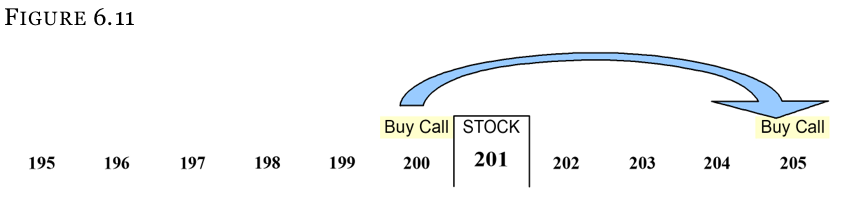
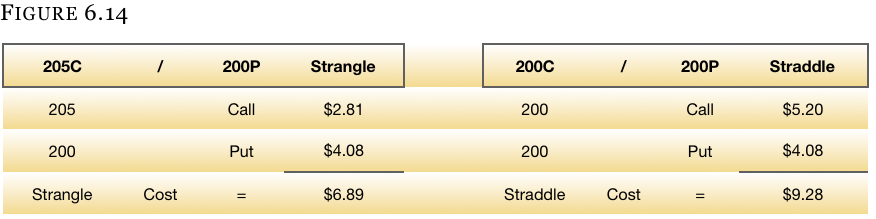
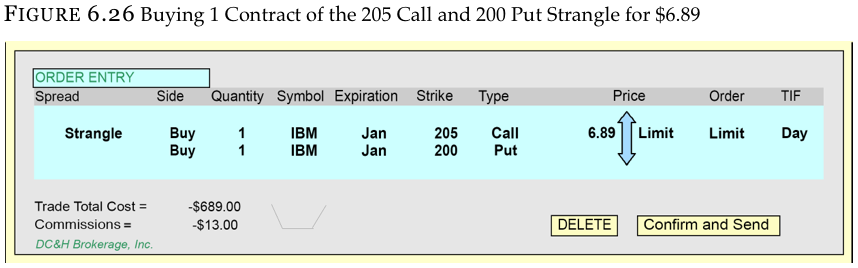
Figure 6.12 is a side-by-side comparison of the 200 strike straddle compared to the 205/200 strangle. This is the most common form of strangles – where both the call and the put are out-of-the-money but they are as close to the stock price as possible.
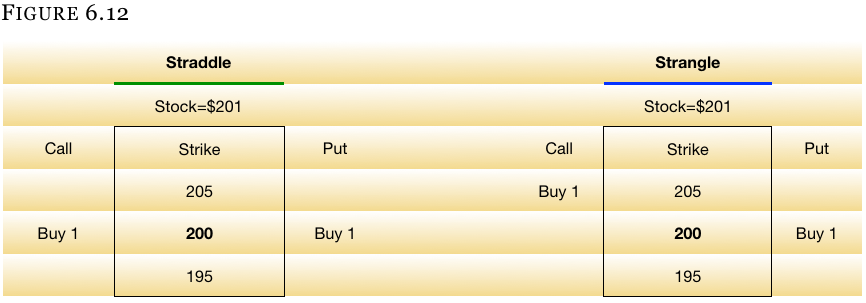
And though this is the most common form of a strangle, having the strike prices as close to the stock as possible is not a requirement. One could place the strangle many, many strikes apart from the stock and it would still be a strangle.
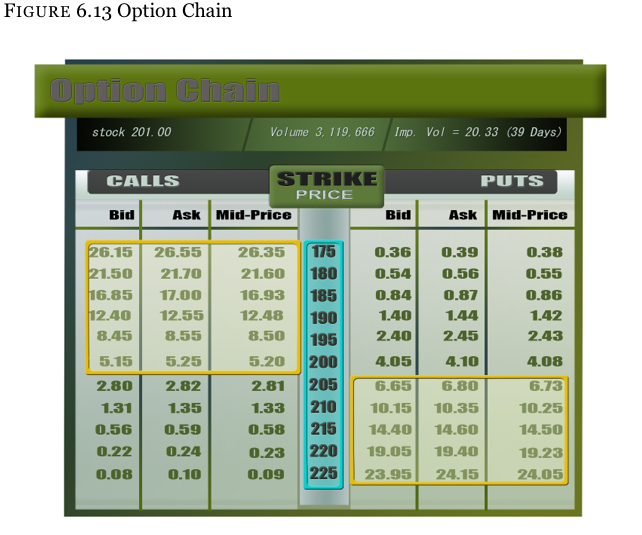
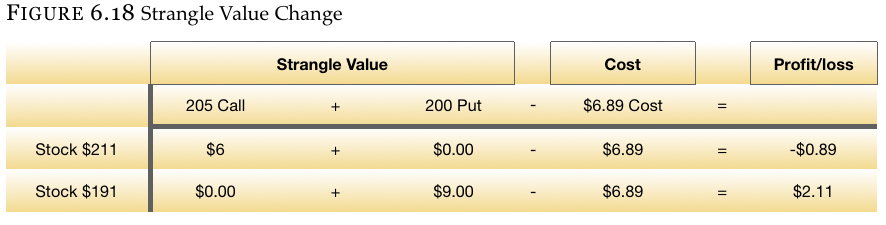
In Figure 6.13, you will see that the 205 call is trading for $2.81 (not $5.20 like the 200 strike call) and the 200 strike put is trading for $4.08. The price of the two combined is the price of the strangle, which is $6.89 ($2.81 call + $4.08 put).
Since the straddle was costing $9.28, the savings when buying the strangle is $2.39 ($9.28 – $6.89), or a 25.8% savings from the cost of the straddle. See Figure 6.14 below.
Look at the graph of a strangle to find the break-even points and see just how much the stock has to move to make a profit on the trade. Figure 6.15 is the graph of the 205 call and 200 put strangle purchased for $6.89.
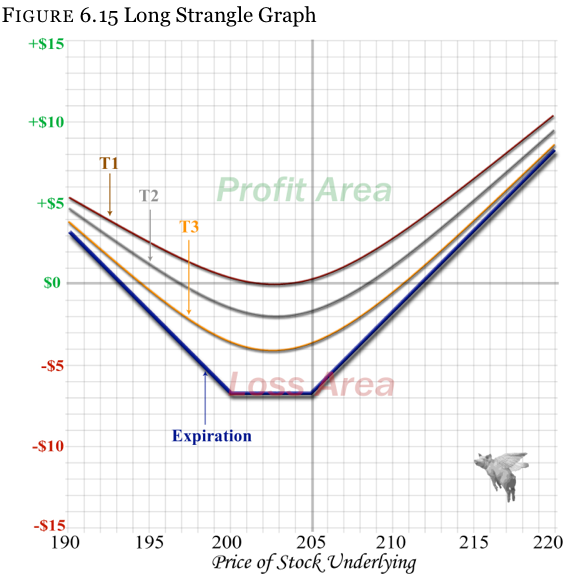
You will notice that, when we were looking at the straddle, there was only one sharp point (the strike price) where you could lose your entire investment when buying this strategy. With the strangle, there is a much wider range where you can lose everything – specifically the entire distance between the two different strike prices.
So why choose a straddle over a strangle? This is really a personal preference, especially when buying the spreads. When selling the spread, it often does make sense to choose one spread over the other.
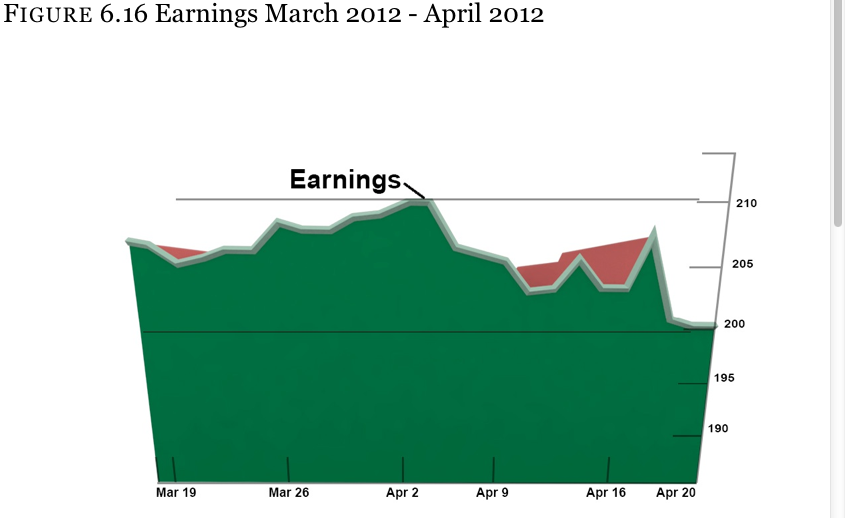
Since you are an avid student of the markets and not prone to allowing laziness and chance to decide your future, you have studied the stock movement every time this name has earnings. You have noticed that the stock moves dramatically up or down after earnings, but it never moves more than $10 in either direction.
The Figure 6.16 shows the last earnings period where the stock started at just under $210 and fell to about $200 – again a $10 move. Most of the move occurred in a 2 or 3 day period, but the selling took a full 3 weeks to finish. Since we will be looking at a 1 month option chain (for this example), this is all we need to know.
Why Not Buy A Straddle?
We know that the 200 strike straddle is trading for $9.28 with the stock at $201 this month. In the previous earnings period, the straddle with about the same amount of time remaining until expiration should have been trading for roughly the same price (about $9.28).
$10 Move
Thus, if the stock is starting out at $201 and we expect it to move ≤$10, we could expect the stock to get up to $211 on the upside and down to $191 on the downside. Having paid $9.28 for this straddle, we could see only a small profit, or even a loss, should the stock move the full amount we expect. And if the stock moves less than the full $10, things get even worse for this position.
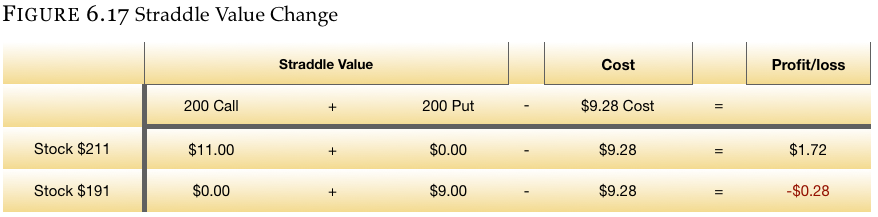
If the stock rises by expiration, it will result in a $1.72 (per share) profit, but at a risk of $9.28 per share. Should the stock fall in price (to $191), we will actually end up with a loss.
The Strangle
The strangle looks a little different in the +/- $10 move scenario. Recall that we were looking to buy the 205 call and the 200 put strangle for $6.89. Thus, the profit and loss of this strangle does not look any better than the straddle.
Sell the Strangle
But what if we were to sell the strangle (instead of buying it) by carefully choosing the strike prices where we felt safe from the =/-$10 move?
Strike Selection
We know we do not expect to see the stock much above $211 (though there are no guarantees) or much below $191.
We can either sell the strikes where we think the stock will hit a road block, or we can add a little more cushion and sell a strike that is a little further out-of-the-money. For example, we believe that the stock can get down to $191 or as high as $211. The closest to at-the-money strikes given those two stock prices would be the $190 strike and the $210 strike (because the stock has $5 strike increments).
If the stock gets down to $191 and we sell the 190 strike put, this put will be $1 out-of-the-money and safe, thus expiring worthless (which is what we want). The call, however, is a slightly different situation. If we sell the 210 strike call and the stock makes it all the way up to $211, the 210 call will be $1 in-the-money on expiration, which we do not want when we are selling the option.
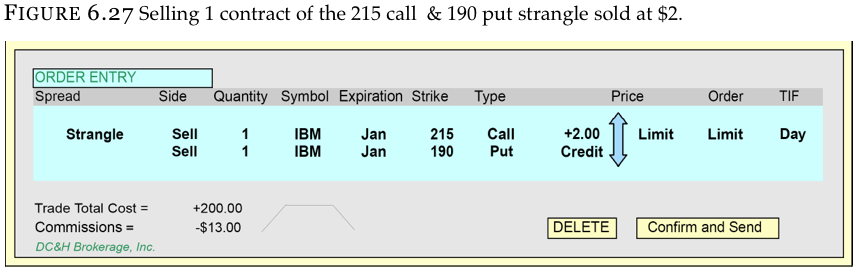
To be safe given what can happen, we will sell 215 call instead of the 210 call since it will not be in-the-money. Should the stock get up to $211, the 215 call will be $4 out-of-the-money.
Figure 6.20 is a comparison of the 200 straddle sold at $9.28, the 210 call and 190 put strangle sold at $2.75, and the 215 call and 190 put strangle sold at $2.00.
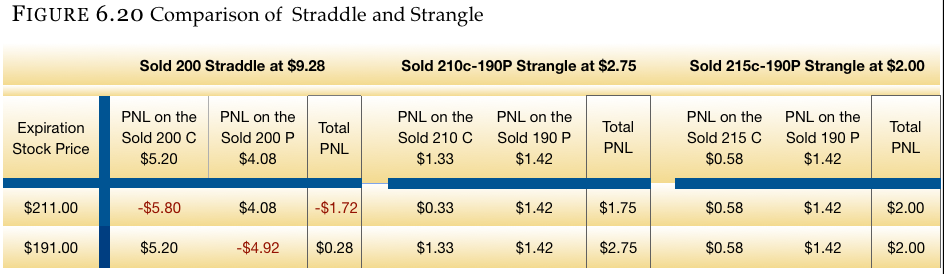
The straddle that is taking in the most credit ($9.28) also made the least amount of money in both the up move and the down move. This is why many people will move from a straddle position to a strangle position – especially when selling options. You will also notice both options expired worthless and the full credit was kept in the last strangle in the example (215 C / 190 P).
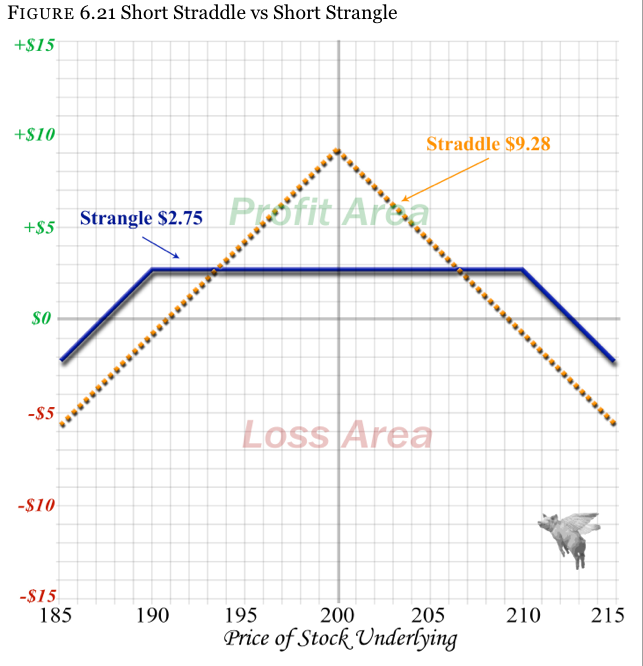
Look at Figure 6.21 graph to understand the strangle better – and see just how well protected it is when you sell it. The graph is a comparison of the 200 strike straddle sold at $9.28 and the 210 call / 190 put strangle sold at $2.75. The strangle has a distinct advantage when you are selling the options, but a disadvantage when you are buying them.
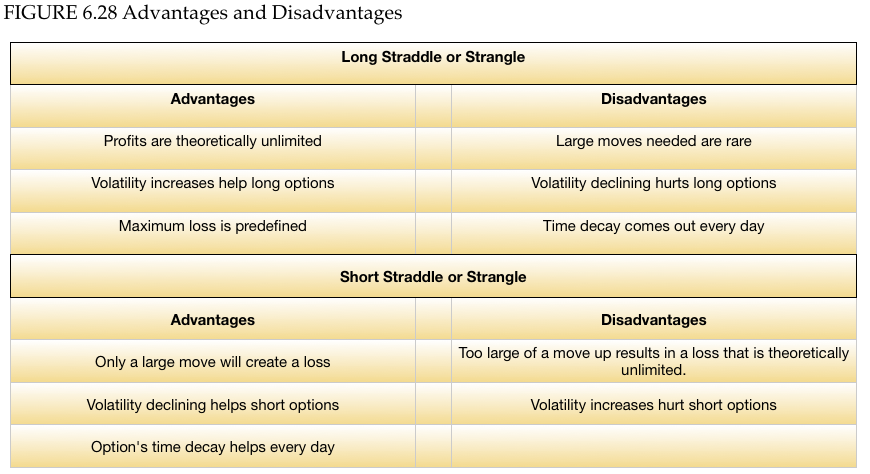
When first learning straddles and strangles people can easily see how the positions are designed to make money on large movement in the stock in either direction. After you have become more familiar with options, you soon realize that there is a second and often even more powerful force affecting the price of these positions – volatility.
Going back to your reading on the greeks, you will recall that “vega” is the measure of how much an option moves in price with respect to a 1% increase or decrease in volatility. The more fear in the markets (usually from fast selling off of the stock), the higher volatility gets. Conversely, when everything seems calm, volatility levels tend to be low. These different levels in volatility will greatly affect the price of a straddle, even when all other variables (stock price, time until expiration, interest rates, etc.) are the same.
The benchmark gauge which most people think about when discussing market volatility is a product called the “VIX” – the “Chicago Board Options Exchange Market Volatility Index.”
VIX
The VIX is a measure of the implied volatility levels of the options on the Standard & Poor’s 500 index. A reading of the VIX levels gives the general public and traders on the floor (known as market-makers) an accurate measure of how the world perceives risk at that moment, and hence it is often colloquially referred to as the “fear index.”
In Figure 6.22, you can see how the VIX had a range from 14% to almost 50% over a 1 year period.
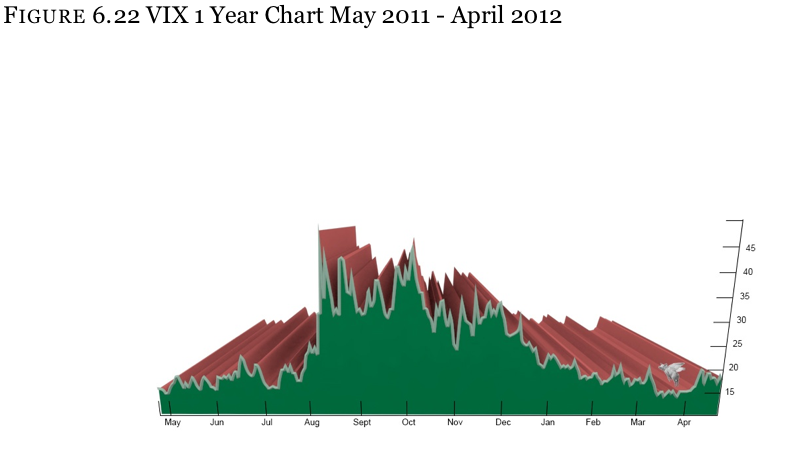
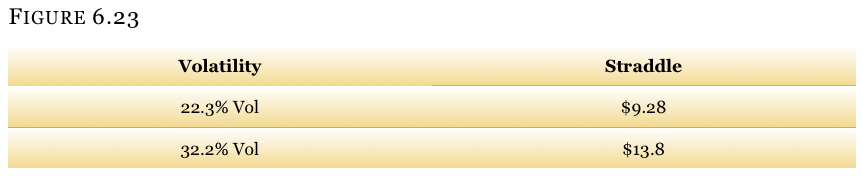
The option prices we have been using were in effect when the stock was trading on a 22.3% volatility. The straddle was trading for $9.28. When volatility increases 10% points to 33.2%, the same straddle with the same amount of time remaining until expiration will be trading for $13.80 – even though the stock has not moved.
Further Reading
At this point you may have either fallen in love with this strategy or decided it is not for you. Please do not rush to judgment quite yet. At the beginning of your reading on options, you learned how market direction (delta) is the hardest thing to predict in the stock market.
[ezcol_1third] [/ezcol_1third] [ezcol_2third_end]Yet one of the easiest things to predict in the stock market is volatility. In statistical language, there is a phenomenon called “regression to the mean”. This is just a fancy term for the process of volatility swinging around an average level. When volatility is dramatically higher than this average (or mean), it has a strong propensity to decline back towards the mean. Also, when volatility is way undervalued compared to this average, it has a good statistical chance of increasing once again. [/ezcol_2third_end]
When options are trading on high volatility levels, they are often called “over-valued”, and when the volatility levels are very low, the options are often called under-valued. Since this phenomenon is much easier to predict than market direction, many of the largest and most successful proprietary firms in the world use buying and selling of option positions such as straddles and strangles to grind out income.
Yet holding on to a long straddle or strangle position waiting for the level of volatility to increase can be expensive. Each day a long position is held results in a cost in time decay. There is good news, however!
Traders have developed a method of trading and scooping up small profits daily as the stock makes its normal swings up and down. The process is known as “gamma scalping” and is found in our text, Option Greeks for Profit, which has been highly praised and is one of the only sources of this information anywhere.
Straddle and Strangle Order Entry
To illustrate what a brokerage firm trading screen may look like, we are comparing the purchase of the 200 strike straddle to that of the 205 call / 200 put strangle. Also, a sale of the 215 call & 190 put strangle will be included.

1.Which of the following is the definition of a straddle:
A _____ A long straddle is the purchase of both a call and a put option, sharing a common expiry month – BUT a different strike price – both options usually are out-of-the-money.
B _____ A long straddle is the purchase of both a call and put option, sharing a common expiry month and strike price – usually done at-the-money.
C _____ A long straddle is the purchase of both a call and a put, sharing a common strike price, but two different expiry months.
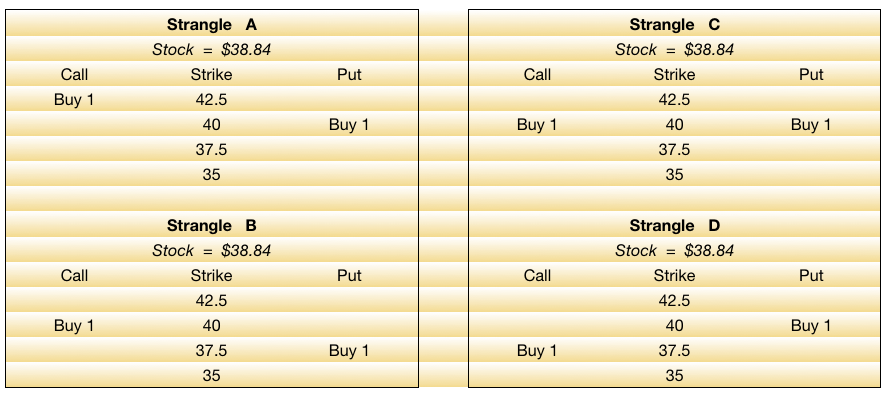
2.If a stock is trading for $38.84, which below would be the most common form of a strangle?
3.If you felt that the stock market was going to move up a fair amount, but nothing really significant, would buying a straddle or strangle make sense?

1.Which of the following is the definition of a straddle:
A _____ A long straddle is the purchase of both a call and a put option, sharing a common expiry month – BUT a different strike price – both options usually are out-of-the-money.
B __X___ A long straddle is the purchase of both a call and put option, sharing a common expiry month and strike price – usually done at-the-money.
C _____ A long straddle is the purchase of both a call and a put, sharing a common strike price, but two different expiry months.
2.If a stock is trading for $38.84, which below would be the most common form of a strangle?
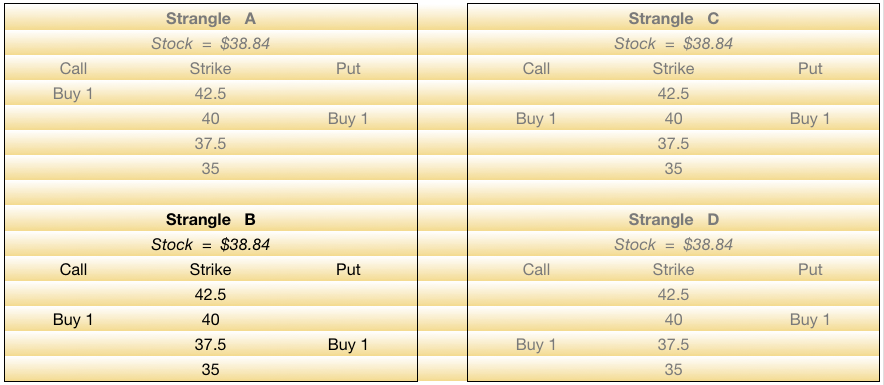
Strangle A
Strangle A is a strangle, but both the call and the put are ITM.
Strangle B
Strangle B is the correct answer. The most common form of a strangle is a position where the call is slightly OTM and the put is also slightly out-of-the-money. In this example the call is $1.16 OTM and the put is $1.34 OTM. Both of the strikes are as close as you can get to being at-the-money without having intrinsic value.
Strangle C
Strangle C is actually a 40 strike straddle – not a strangle.
Strangle D
Like strangle A, both of these options are ITM. What is different about this strangle is that the call is at a lower strike price than the put. One never sees this in a common strangle, and this position actually has another name – it is called a “mombo – combo”, or also called “guts”. Very few people trade this type of a strategy to open a position.
3.If you felt that the stock market was going to move up a fair amount, but nothing really significant, would buying a straddle or strangle make sense?
Answer
This is a difficult question to answer without given specifics about how much the stock is going to move up. The purpose of this question is not to see if you can determine what the intrinsic value of a straddle will be worth on expiration should the stock move a certain amount in either direction. Rather, the question is designed to get you to think about if this is the best strategy given your opinion of the markets.
Distance
We know that straddles and strangles make money only if the stock moves enough to cover the amount paid for the position, and then some. The question was purposely vague as that is how opinions on the market typically are. Most often people will not say “I have a feeling the stock is going to $215 or $220 by expiration”. Typically being opinionated on a bullish or bearish move is a hard enough call to make.
Yet, we did state in the question that we believe that the stock is going to “move up a fair amount, but nothing really significant”. This is the first hint that a straddle or strangle may not be the best of positions. But there is another component to this question.
Direction
We stated that we felt the stock was going to move higher. We have already learned that as the markets advance the volatility tends to decline. Since we are buying a straddle or strangle which has a long volatility (vega) component to it, we can expect to lose money due to the decline in volatility.
Had the market direction been determined to be one of a downward movement, our opinion might have changed. A market decline typically sees an increase in volatility. Being long a call (which is long volatility) and long a put (which is long volatility) will usually benefit from an increase in implied volatility levels provided that the selling does not occur to late in the expiry cycle to be of benefit.
To quantify this better, referring back to the section on the greeks we know that the 200 strike call has a vega of $0.16 (meaning it will move $16 per option for every point in volatility it moves), and the 200 put has the same vega. The two positions combined create a straddle which has a vega of $0.32.
Since options have a multiplier of 100 shares per contract, a 1 point move in volatility will result in a profit or loss of $32 per straddle. When we buy a straddle (or strangle) we are long volatility. If volatility collapses to a lower level when we are long it, we will have a loss. Thus, if volatility fell 3 points, we would lose $96 on the straddle (all other variables remaining constant).