
Practical Relative Strength
(2009 Webinar 2, Week 2)
Mastering the art and science of relative strength will pay dividends whether you are looking for a long term investment for your retirement portfolio, a medium time length trade to follow a trend, or simply a day trade (or legging into a trade).
Relative strength is how an individual stock or market sector is performing compared to the index to which it is matched.
In many floor traders’ careers, real profits do not start coming until they can utilize a practical application of their theoretical knowledge of relative strength. This section of the Online Coaching Program should pay for itself many times over. Many of the best trades are executed when patience is exercised and a little homework is done to look for stocks and indexes that are stronger/weaker than the market as a whole. Our favorite stocks are the ones that are giving us an edge – not ones that have a product line we like.
Four Topics
There are four primary items we will focus on for this section:
- Beta
- + and – vs. – and + moves
- Bottom bounces and top reversals
- Fading news
Though there are many other nuances that can be attributed to relative strength, the primary influences can be broken down to just a couple. They will each be addressed independently since they usually act independently from one another. One can be pulling while the other is pushing, but the overall effect is felt. When they are all working in unison you have a stock, index, or commodity that is trending so hard that even the most passive investor sees it and wants to jump on board – this forms a bubble.
1. Beta
Beta is a measure of the expected return of a stock as it correlates to the market/index as a whole.
A stock that has a beta of 0 (zero) is not correlated with the market and moves independently of anything going on in the markets.
A stock with a positive beta moves as the market moves. For example, a stock that has a beta of 1.4 will generally move 1.4 times as much as the market as a whole. If the market is up 1 percent, then the stock that has a 1.4 beta will usually be up (all other variables independent) by 1.4%. Conversely, as the market declines 1 percent, the stock with a beta of 1.4 will usually decline 1.4 percent. There are positive and negative repercussions for making money from the bullish side.
A stock with a negative beta moves inversely with the markets. A stock with a negative 1 beta, for example, will move down 1 percent when the market moves up 1 percent.
Beta can be a bit misleading to people trying to pick stocks that are likely to outperform the overall market. Suppose that the Dow Jones Industrial Averages (DJIA) are up 1 percent. You look through your list of stocks and notice that Apple Computers (AAPL) is trading at $94 so it is up $1.32 on the day.
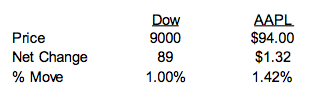
One who is quick with math in his head will notice that Apple is up $1.32, and because the stock is under $100, the stock is up well over 1% on the day. In fact, the stock is up 1.42% so it must be much stronger than the market as a whole. Actually, since the stock has a beta of 1.4 to the Dow it is perfectly in line with where is should be with the Dow up 1%. It is neither stronger nor weaker than the overall market.
You can see from this example that when you are looking to find a stock that is outperforming the markets (either to the upside or downside) you need to keep the stock’s beta in the back of your mind so you do not give yourself misleading information. Once you have taken this into account, you can then proceed to the next stage of analysis: “+ and – vs. – and + moves.”
2. + and – vs. – and + moves
This is the most important item when looking for a stock that is outperforming the market.
“+ and – versus – and + moves” are the study of finding stocks that are outperforming the market regardless of any other variable at work.
It is also the easiest way of finding stocks that are stronger than the overall market. Initially, you only need to find stocks that are staying in the positive on days the market is down. The thinking is that, if a stock manages to remain in the positive while the market as a whole is in the red, this stock will have enough demand to greatly outperform the market when the overall market turns direction into the positive territory.
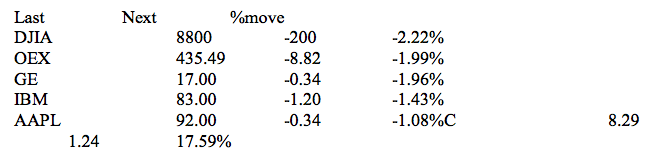 A quick glance at the quote page above reveals an easy to see item. With the overall market down roughly 2 percent, Citigroup stock is up 17 ½ percent. As a matter of fact, Citi Group is the only stock in our watch list that is up on the day.
Any news, earnings, etc. aside, this is a very bullish sign for someone looking to take a position. If the market reverses, day traders will see great things happening. With the Dow down 200 points, the stock is very strong, but if the Dow is at a bottom for the day, things can get very interesting. Picking a stock like Citi can be a huge advantage for those wanting to take a bullish position, especially in volatile markets where the overall market can be down 200 or 300 points at one time but can be up 200 points an hour later.
Even if your assumption is wrong that the market is at the bottom of the daily range, you will likely not get badly hurt compared to other stocks. Many times the Dow can fall another 100 or 200 points but a very strong stock won’t retreat more than a few pennies (if anything at all).
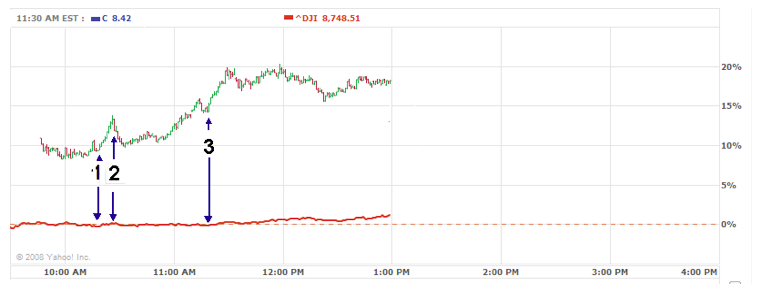
A look at the chart above reveals some interesting information which could have been profitable. Notice that
- at period #1 the Dow (red line) was down on the day, yet Citi (the jagged line above) was up on the day.
- Once the market bounced a little as seen in time period#2, Citi spiked up strong.
- Later in the day around 11:15 (time period #3), the Dow went into the red again, and even though the stock was dragged down slightly in sympathy, it was still near the highs of the day (up to that point).
The sell-off in the Dow to negative on the day saw Citi simply fall from being up about 16% to up 14% on the day. Then later in the day (around 11:30), the market went into the black again, and Citi ran up 20% on the day.
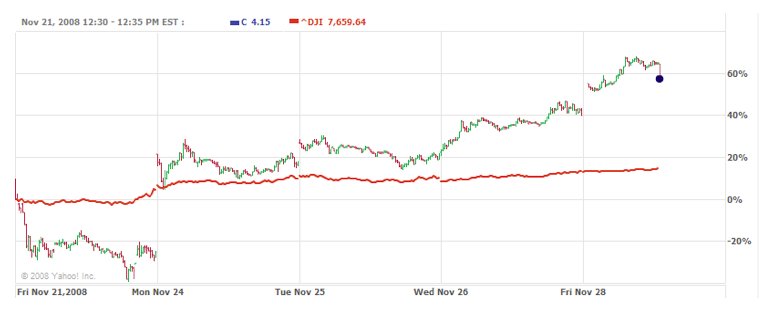
This is the wonderful thing about relative strength. Even when the market was not helping in any way by going negative on the day, the selected stock (which we might have had a long position in) was running higher. The path or least resistance on this stock is higher and that is the way we would want to play the stock. As a matter of fact, a look at the stock for an entire week reveals the same thing as above but for a time frame of a week.
You will notice in the chart below that the stock underperformed the market as a whole on the previous Friday, but on Monday things changed for the rest of the week and the trend may now be in place for a while.
Short, Medium and Long Term Traders
Many types of traders will benefit from such a phenomenon.
Short Term: Short term traders and day traders will have a huge edge over the statistical odds of picking a winner when employing such thinking in their trading. Picking up a stock can be relatively safe even if you miss the dead bottom when the overall index that is used to measure the performance of a particular stock’s industry has an ebb.
Medium Term: Traders who trade place trades in a time frame of a few days to a couple of months can also find huge benefit from relative strength. The only difference in perspective from that of short term traders is the belief that something in the fundamentals of the stock is going to have bargain shoppers acquiring that particular stock. In the case of Citi, the stock currently hit a low of roughly $3 and closed at about $3.77. Over the weekend, the government stated that they will add money to Citi’s coffers to ensure that the company will be adequately liquid.
This news is very bullish for the short term as well as the long term. Many people were speculating about the demise of Citi and the stock took a hit. With assurance from the government that they feel Citi is too big to fail, the company’s demise is out of the question, but it is not financially out of the woods.
Long Term: Traders who take positions that they intend to hold for months or years (or indefinitely) will also benefit from relative strength but must also take into account fundamentals of the market as a whole and the stock (systematic and non-systematic risk respectively).
We see from our Citi example that the stock may have hit a bottom and bounced. Medium term traders know that stocks that have been hit very hard may have a short term bounce while people who are short the stock rush to recover since they know the bottom has been made. However, a long period of consolidation may occur before the turn up for the long term happens. Medium term traders, and especially long term traders must make an educated guess about the bounce’s sustainability. In other words, even though the stock seems to have found a bottom and bounced, is this bounce a long term or short term phenomenon?
In the Citi’s current case, one could make an argument that the bounce is going to be a long term bottom since the fears prior to the bounce were that Citi was going to go out of business. Now that the government has basically stated that it will not allow the company to go under, the over selling that occurs in panic situations is completely over and the mentality has likely shifted to “I can’t believe I sold my Citigroup stock at $4.” Again, the long term trader has benefited because he is focused on finding a bottom as opposed to simply finding something that is going to be stronger than the overall market for a few days.
The same thinking also works in reverse. Finding a sagging stock to sell short while the market is advancing is a good way to get short the market. If the stock also happened to be one that was part of a leader in a large overall market rally and is starting to lag the weakening bull market, you may have found the indicator of a bull market coming to an end – not to mention perhaps finding one of the stocks that will suffer the most (to your benefit) when the trend reverses.
Caveat:
At the risk of sounding repetitive, the trader will want to make sure that he is not getting duped by forgetting to take the stock’s beta into account when looking for candidates. A little patience in not jumping onto something too fast usually pays off.
3. Bottom bounces and top reversals
Bounces off a bottom are one of the trickiest environments in which to trade.
Watching a good stock that has been considerably sold down is a very important art in long term value investing along the lines of what Warren Buffet does for a living. Typically a good stock usually falls as a shift in the thinking of the company’s financial future comes into question. Turnover of key people, sagging earnings reports, FDA rejection of drug approval, etc. are the reasons for a company’s stock to fall precipitously and become “cheap” from an investment perspective.
Once a bottom is found it is tempting to jump in. You will typically see the stocks bounce come as the stock outperforms the market and sector as a whole. This can be very tempting to get in near the bottom, but more often than not, there is still plenty of time.
Since a good portion of the stock selling came after missed earnings reports, the stock most likely will not advance back towards previous levels until earnings reports come out three, six, or nine months later indicating that the company has gotten back on its financial track.
The original bounce typically comes after some informal announcement by the company who is seeing its stock value deteriorate and wants to stop the bleeding, or from analysts who are looking to sell their crystal ball, or from large institutional firms who have a vested interest in the stock rebounding. Once this bounce comes the stock will generally outperform the overall market and the sector, but this is usually short lived.
The bounce is usually early bottom fishers and shorts closing out positions before they give back too much of their profits. Many technical traders who adhere to different brands of technical analysis will typically say that the stock should retrace roughly 50% of the fall, and then go back down and “test the old lows.” Whether there is a solid reason for this or it is simply a self-fulfilling prophecy it does tend to happen enough times with stocks for people to notice a trend and play it that way.
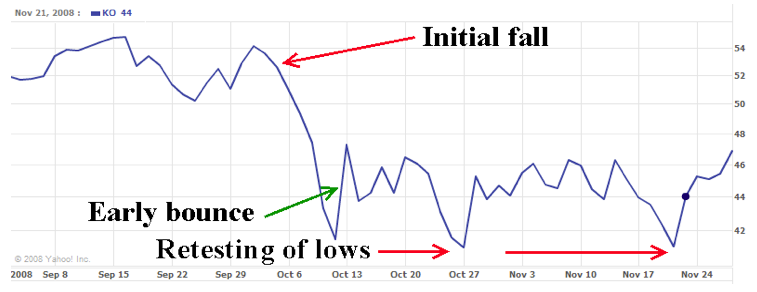
The chart above is that of Coca-Cola Co. (KO) up to the 1st of December, 2008. You notice that the stock had a very heavy and steep drop for KO. At about October 10th, the stock hit bottom and bounced hard, though not making it to the full 50% retrace area. At this time, people who were early and looking to pick up KO cheap may have jumped in and brought the stock all the way back to $47 only to see a loss of $6-$7 per share in two weeks.
Also notice that the stock has currently (December 1st) hit its head on the top of the highs from the bounce back. This is a place where the stock will likely squirt higher at a fast pace or sell off again to the $41 area.
Many straddle traders look for this. When the stock is at the lows, the volatility will be high, but after a few days of the stock running higher volatility tends to subside a little and both the calls and puts will be cheap relative to where they were trading when the stock was lower. Since we are at an area of uncertainty, with regard to the direction of the stock deciding on being bullish or bearish. The cheaper options make trading a straddle a good strategy in this scenario.
Other traders will wait to see how the stock acts at these levels. If it goes higher from here, there is a decent chance that the stock will continue its climb back up you may simply want to play things from the long side.
Top Reversal
Although, a top reversal is a much better play for those who are looking to profit from downward trends in the market. Stocks that have been the leader of a bull market tend to weaken compared to the overall market right before the market heads for a correction. This is a great foreshadowing for a drop in the stock and also for the market as a whole.
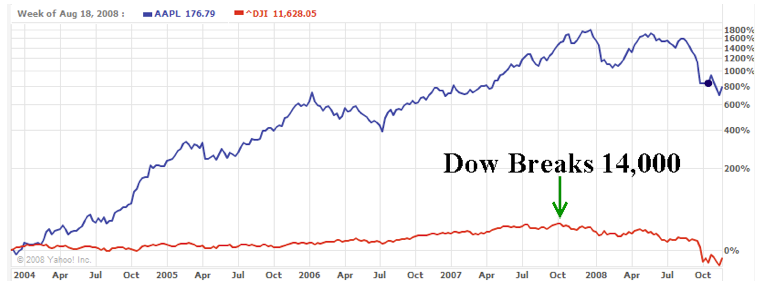
The above 5 year chart is very telling, and probably the closest thing we will have to a crystal ball in this industry. Prior to time period #1 on the chart below, AAPL stock led the market higher. The stock had been badly beaten down from the time Steve Jobs left AAPL to the time he came back with rumors of it possibly going out of business.
Steve Jobs did perhaps one of the greatest come-backs in business history ever with the Apple notepad, iPhone, and iPod. The stock soared from the teens to over $200 per share. This stock could arguably be a big reason for the bull market that ended in October of 2007 when the Dow broke through 14,000.
The chart below is a shorter time frame to give more meaning to the information. The chart is a comparison of Apple stock (in blue) to that of the Dow (in red). Notice that, in the previous chart, Apple’s stock greatly outperformed the markets, but then it sort of teetered out. Time period #1 below shows an area where Apple stock started to perform with the market instead of over performing, suggesting its advance was tiring out.
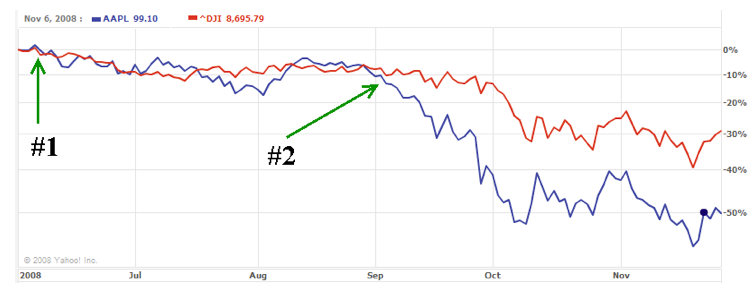
Time Period #2 shows where AAPL actually began to underperform the market and then overall markets began to collapse with the Dow falling below 8,000 one year later.
Getting a handle on these situations can be a bit tricky and the timing is never perfect, but a good trader who knows what to look for can make (or save) a fortune when he sees these warning signs. The good news is that this phenomenon has been around since the beginning of the stock markets and likely will not end anytime in our lifespan. Always use whatever stock(s) are the leaders in a bull market as a barometer of when they are losing steam. Once they get a push off the cliff, the rest of the market tends to act like a lemming and follows. Understanding just this one piece of information is worth significantly more than the price of this course.
4. Fading news
There is one last piece of information that has great impact on the markets and allows traders to get a handle on the relative strength of a stock – the news phenomenon. This may prove to be especially valuable coming up soon after the 2008 holiday shopping season where retailers and owners of those stocks are bracing for what could be an abysmal year now that the Fed has announced the market has been in recession since the 3rd quarter of 2007.
There is an axiom of knowledge for almost every situation in the markets, but the one that pertains to this section is, “Buy the rumor – sell the fact!”
This means that many stocks tend to run up in advance of news and earnings reports, but once the news or numbers are publicly disseminated, the stock will sell off anyway. Even if the news is even better than anticipated, the stock ran up so far in anticipation of good news that there are no buyers of the stock left. When the stock does not advance further, fear comes followed closely by selling.
Exception Example #1
Remember to distinguish whether the stock is in a long bull/bear market or not. In our previous APPL stock example, the stock was gifted exceptional generosity by the markets. After earnings came out which were expected to be good, the company attempted to calm the enthusiasm many times by stating that the growth could not sustain itself. Instead of selling off which many would expect, the stock continued to run higher.
Exception Example #2
Another example of this is the dot com craze for the last 2 years of the 20th century. The years 1998 and 1999 saw our Federal Reserve board chairman, Alan Greenspan, attempt to stop the Las Vegas-like speculation on the dot com stock by stating that they were overvalued and followed by his famous “over exuberance” speeches. Yet, no amount of water handed out by the Fed could extinguish the fire. Often after Greenspan spoke the Nasdaq would tack on another 50 points within the hour.
These two examples show when the adage of “buy the rumor – sell the news” does not pan out. There is no magic formula for knowing when it is going to occur. What one has to do is distance themselves from the markets and get perspective while saying to oneself, “Is this a strong bull market of something that is only occurring right before the news/earnings?”
If there is not a strong bull or bear market going on in that universe and that particular name, then the adage of “buy the rumor – sell the fact” should prove very beneficial. It is also why Random Walk is not real fond of buying straddles prior to earnings. Typically, volatility is at its highest the day of the earnings announcement, so any news (good or bad) that is extremely different from what was expected will usually result in any long term speculation in straddles prior to the earnings announcements losing.
In conclusion, bull and bear markets aside, “fading” the market trend before earnings and news announcements can be a very profitable situation for short and medium term trades; however, those playing the long term “buy and hold” scenario shouldn’t consider the step as important.
With the retail season looking gloomy and many companies lowering their estimates on earnings for the season, stocks are getting pummeled. Many retail stocks are trading horrendously in anticipation of a very poor shopping season. Prior to earnings, we could see the stocks sell off with a relief rally once the numbers come out (even if the numbers are poor). The “buy the rumor-sell the news” could be reversed from normal with a new recession adage of, “sell the rumor – buy the news.”
Conclusion
We covered four of the most significant tenants of trading from relative strength. Using beta as a means of keeping things in perspective we learned about “+ and – versus – and + moves.” We also learned about bounces off of bottoms and the danger in trading them too soon if you are looking for market direction. The bounce could also be a possible warning that the trend may be short lived, even if the stock is relatively stronger than the market as a whole. We also learned about the amazing forecasting of market reversals off of the top and how they can be an early warning system for measuring a changing in a large bull or bear market. Nothing can come close to that in power, and it is usually missed by the technical analysis people, though we are not saying anything disparaging against TA. Lastly we learned about news and when it is safe versus when it is a dangerous to fade.
The next part of this section contains some practice questions for you to solidify your knowledge. Good luck and have fun with your new knowledge – it could save you a fortune in hidden quicksand.