
We have one last thing to cover before we show you examples of trades and teach you practical strategies. We saw that the line for expiration and the line for the present time will eventually meet on expiration day in PNL graphs. Many people will be taking this one step further in their head and ask, “But how do they meet, how fast, etc.?”
This is a great question that can best be answered by going into the option “greeks”. When mentioning option greeks, we typically see two reactions: a look of confusion (“What are they? Are you talking about George Soros?”), or a look of horror (much like the look you see on people in the waiting room of a dentist’s office).
We have taught the greeks to thousands of people and only a handful of people felt like they had a root canal, so do not be intimidated by the following material. This will be fun, easy, and if you open wide, you will get a lollipop at the end.
Greeks Preamble
The difficult thing about being a stock or futures trader is that you have to be able to predict the future, and you must be correct when you guess which way the market is going to move (up or down). This is very difficult – which is why so few fund managers can ever beat the performance of the overall market.
Whenever you are buying or selling stock, you may not realize it, but one of the greeks is at play – delta.
Delta is just a fancy term for market direction. In every field of work – whether it be law, construction, police, medicine, or trading – a new language emerges to keep the outsiders confused. That may not be the actual reason, but when talking to a doctor or lawyer, it certainly feels that way, doesn’t it?
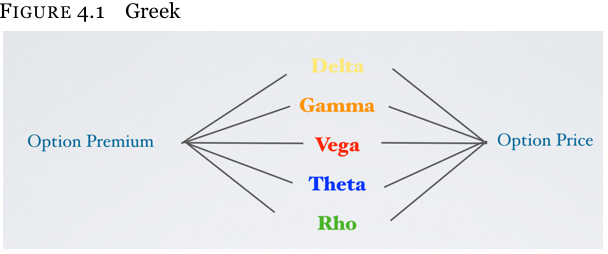
Once you get a tangible feel for the greeks, the mysteries surrounding options and how they move will disappear. The great news is that stock only has one greek that you can use to make money – delta. This is the most difficult of all the greeks to predict, so knowing an option that has five greeks gives you four other tools which you can use to make money.
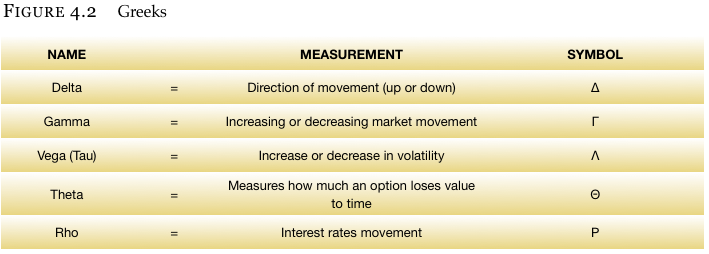
Greek Overview
There are 5 greeks that comprise the price of an option, just as there are 5 items you need to make a great cup of coffee (coffee machine, coffee beans, water, drinking mug, and a power outlet).
Delta
Delta is the measurement of how much a call or put option moves with respect to the price of the stock moving $1.
Delta Analogy
 [/ezcol_1third]
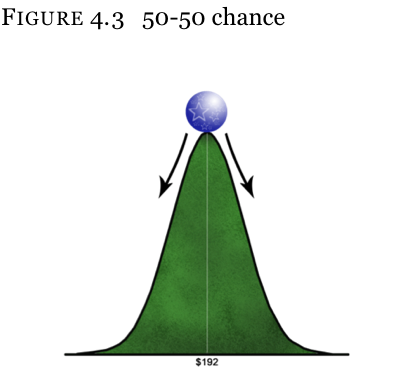
Think of a ball on the apex of a steep hill. Assuming that there is no prevailing wind, the ball has about an even chance of falling in either direction. If the odds are exactly the same, we could say that the ball has a 50 – 50 chance of going to the left or the right. Delta works the same way. It is a measurement of probability and tells us how much the option will move when the stock moves.[/ezcol_2third_end]
Delta tells the option trader the exact probability of that option having real value on expiration. When we look at PEAR, we see that the stock is trading at $192. This means that it has a 50% chance of going below $192 on expiration, and a 50% chance of going above $192 on expiration. Brokers will try to tell you that “stocks are up 10.4% a year on average over the long run” but don’t fall for the trap. This mentality is a fallacy and will be addressed later.
If you know that the market has a 50% chance of closing above $192 by expiration, and you are looking at the 200 strike call (that is OTM), you know the odds of it being above $200 are less than 50%. The reason is because the stock has to go to $193, then $194, then $195, etc. to get to $200. What the probability is and how it is measured is based on many variables like the time remaining until expiration (stock is more likely to move with more time), volatility (a lively stock is more likely to go up $8 compared to a dull stock), etc.
This will become very important shortly, but it is not that complicated.
Option Delta
Delta is the amount an option will change in price as a result of a $1 move in the stock (positive or negative).
Since a stock that moves up $1 will make $1, and a stock that moves down $1 will lose $1, this stock is referred to as having a delta of 1. When dealing with options, though, things are a little different. And since options have a 100 multiplier (100 shares of stock per option contract), it is very common to hear of stock delta being 100 – meaning we are dealing with 100 shares. Don’t worry; we will be clear when speaking so as not to confuse you.
Suppose that you have an option that is considered to have a 0.40 delta (40% of stock’s delta). Because this is 40% of the stock’s delta of 1, it will move $0.40 cents for every dollar the stock moves. If the option had a 0.60 delta, it would move $0.60 for every dollar the stock moves.
Call Delta
When you buy a call, you are expecting the stock to advance, so purchased call options have a positive delta. If you sell the call, you want the stock to go down, so it will have a negative delta.
Long Call Example
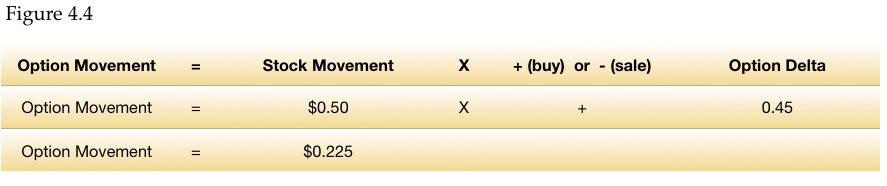
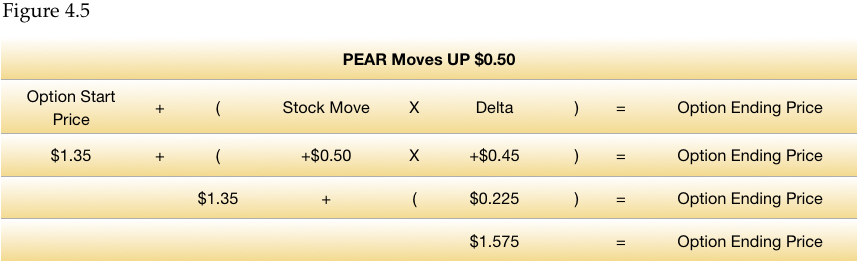
Suppose that you bought the PEAR 195 call when the stock was at $192. We can say for now that this option might have a delta of 0.45. When buying the call, you are doing so because you are expecting the stock to move higher, and you want to own it at 195 regardless of how high it moves. Thus, as the stock moves up in a positive manner, the call price should move up as well. How much will it move up? The call price will increase by $0.45 for every dollar the stock moves higher. If the stock moves higher by only $0.50, then the call will move higher by 45% of $0.50 (stock move), or $0.22½ cents (0.45 delta X $0.50 stock move).
Also, if you sell the option, then you think the stock is going to move down (or stay stable) and the call will go out worthless, thus you are able to keep the premium at which you sold the call. So long as the stock does not close above the 195 strike price on expiration, you will keep the full $1.35 for which you sold the call. Because you want the stock to go down in value, you know you could end up losing money if it goes higher (the designation for a short call is a negative sign in front of the call). This will make sense in a second.
Long Call Delta Formula
When getting complicated and/or multiple positions in your account, knowing what will happen to the positions given any stock move makes it a lot easier. This is a very straightforward concept that can be learned by simply remembering one rule.
Calls have long deltas; while, puts have short deltas. If you buy the option make sure it has a (+) sign in front of it, and if you are selling the option make sure you have a (-) sign in front of it.
You are long a 0.45 delta call and market moves up $0.50.
Start and End Price
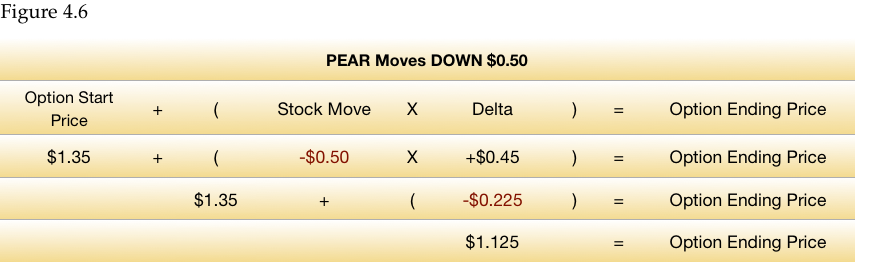
So what does this mean in practical terms? Since we are buying a call and want the market to advance, we know we will make 22 ½ cents if the stock goes up $0.50. We also know that the opposite is true and the option will go down 22 ½ cents if the stock moves down $0.50. Sometimes an easier way to see this is to look at the math in Figure 4.5.
Quick Math Refresher
Before we go further, we know it has been a long time since many of you have been in school with nuns hitting your knuckles for a wrong answer. Calculators costing less than $1 have replaced most of our thinking. For this reason, just to keep us honest, we have included a quick multiplication refresher since we will be dealing with negatives and positives. Read the rest of this text before you ask for a refund so you can go to truck driving school instead. Rest assured that this is not too difficult and you can use a calculator if you like.
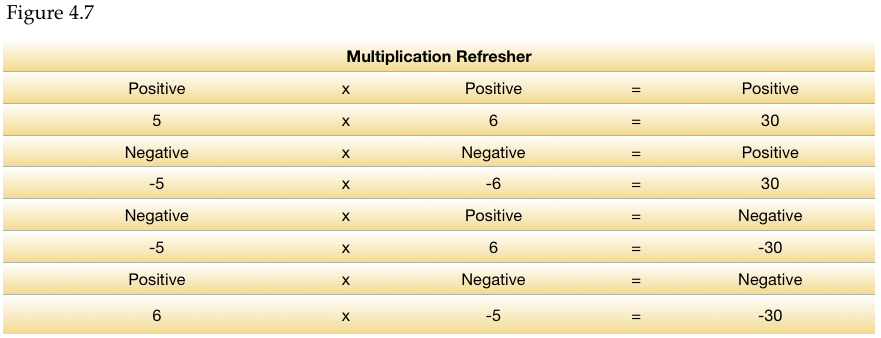
Multiplication Order of Operations
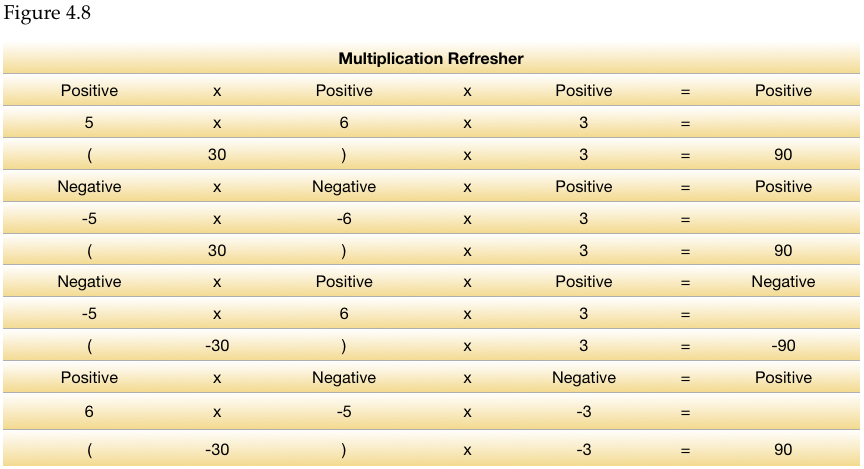
- When there are three or more numbers in a sequence, begin by multiplying the first two numbers. Afterward, multiply the result by the next number, and so on.
- Lastly, we know that multiplying anything by one does not change the number. So when we are using a sign, such as a positive (+) for a purchase or a negative (-) for a sale, we can insert a one.
More Call Examples Using Delta
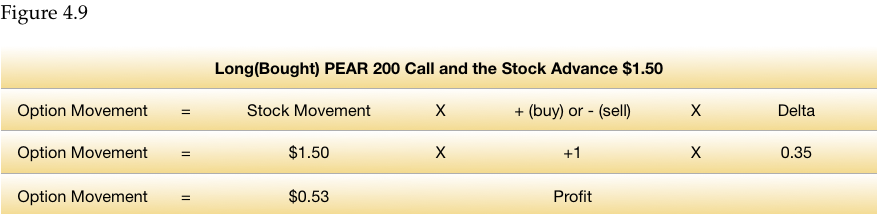
To get a deeper understanding of how this works with calls, we can go through four examples (buying call, selling call, market up, market down):
A. Buying a call and the market moves up
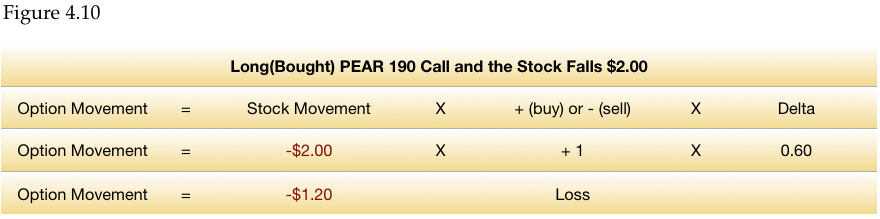
B. Buying a call and the market moves down
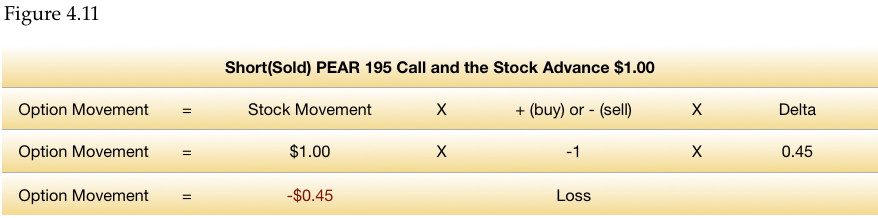
C. Selling a call and the market moves up
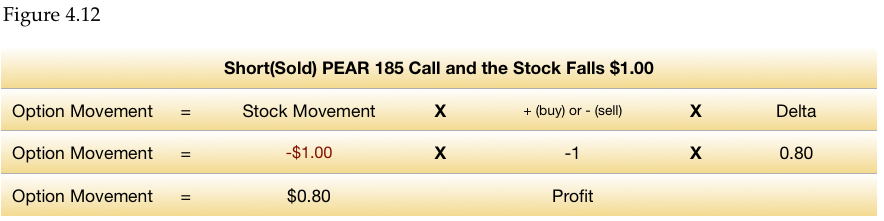
D.Selling a call and the market moves down
Put Delta
When you buy a put option, you are expecting the stock to decline, thus purchased put options have a negative delta. When you sell the put, you want the stock to go up, so it will have a positive delta.
Long Put Example
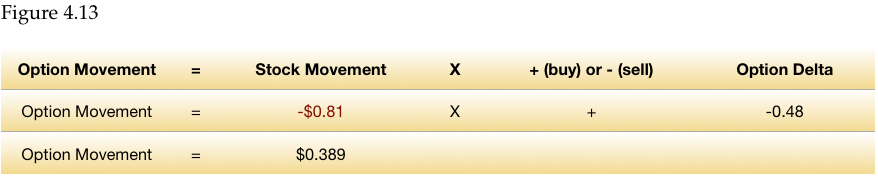
Suppose that you bought the PEAR 190 OTM put (out-of-the-money) when the stock was at $192. We can say for now that this option might have a delta of 0.48. When buying the put, you are expecting the stock to move lower, and you want to sell it at 190 regardless of how low it might move. Thus, as the stock moves down in a negative manner, the put price should move up as well because you can sell it at a higher price than others. How much will it move up? The put will increase by $0.48 for every dollar the stock moves down. If the stock moves down by only $0.81, then the put will move higher by 48% of $0.81 (stock move), or roughly $0.39 cents (0.48 delta X $0.81= $0.389 stock move).
More Put Examples
To get a deeper understanding of how this works with puts, we can go through four examples (buying call, selling call, market up, market down):
A. Buying a put and the market moves up
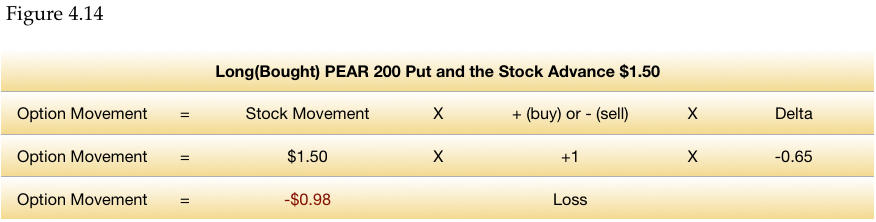
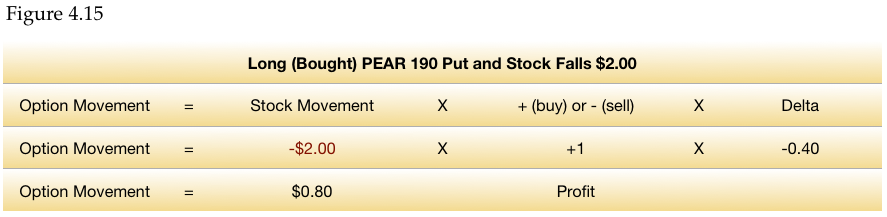
B. Buying a put and the market moves down
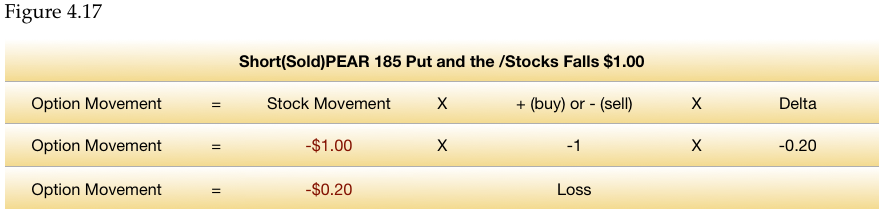
C. Selling a put and the market moves up
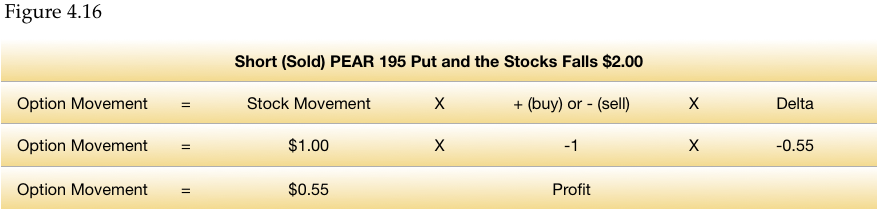
D. Selling a put and the market moves down
Confused?
This is often confusing for people because many publications refer to this 40 delta option as 40 and 0.40. Technically, it is correct.
But how could it be the same thing when written differently? Even professionals find this confusing. It depends on if the person is referring to the 40 delta being before or after the multiplier (100 shares per contract). For purposes of convention, the correct way to write something being 40 deltas is 0.40. For example, if you are looking at a 0.40 delta option and multiply this by 100 shares per option contract, you will get 40 (0.40 delta X 100 shares = 40). By writing it out this way, the math in complex option pricing and portfolio management situations becomes easier and fewer errors are made.
The same phenomenon will be at work with all the other greeks as well, so the good news is you will not have to learn anything new.
Gamma
Gamma is the measurement of how much a call or put delta moves with respect to a $1 point move in the stock.
Request Video of Option Basic Seminar ? Click here
Gamma Analogy
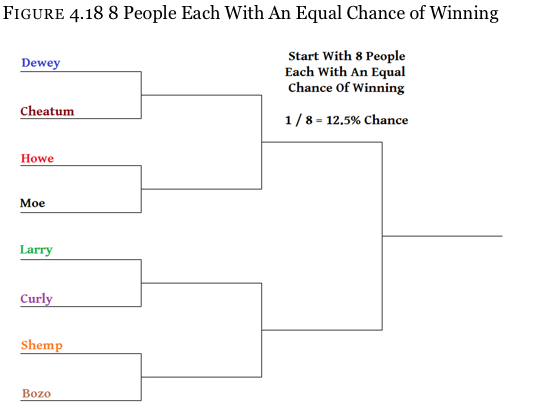
Let’s use our experience with contests as a starting point. This could be the NIT baseball championships, a presidential race, competitive basket weaving (my major in college), or a senate race. Whatever the competition, we will assume that we are starting out with 8 contestants, all with an equal chance of winning.
During the first round of competition, each contestant will be paired against another in four simultaneous contests. The winners all proceed to the next round while the losers return home.
Since each of the contestants has an equal chance in the beginning, they all have the same mathematical probability of success. At the start of the competition each contestant will have a 1 in 8 chance of winning, which translates to a 12.5% of final victory (1 divided by 8 = 0.125, or 12.5%).
You decide to bet on Cheatum for no other reason than it sounds like the best name for a politician. As it turns out, your decision was fortuitous; Cheatum wins his contest against Dewey, and you proceed to the next round.
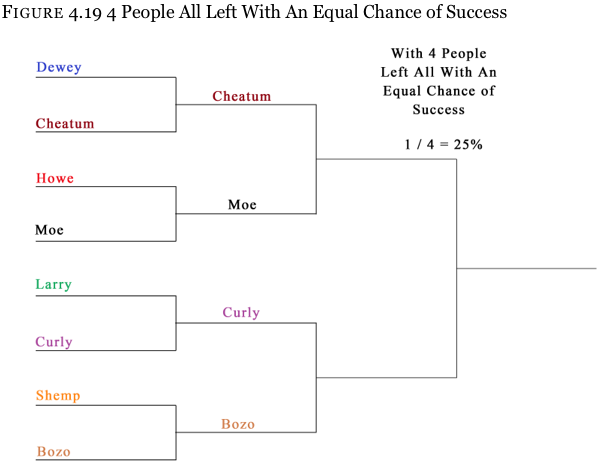
Second Round
With the first round over, 4 people have been eliminated and 4 people remain. Your pick (Cheatum) gets matched up against Moe, while Curly is to compete against Bozo.
Since there are only 4 contestants now, and since each contestant still has no advantage over any other contestant, the odds of success are 1 in 4, or 25% (1 divided by 4 = 0.25, or 25%). And what do you know? Cheatum pulled some shenanigans and won this round as well, advancing to the next.
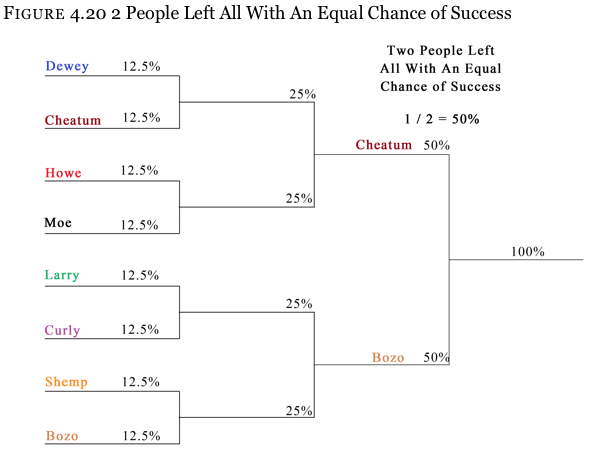
Third Round
The finals approach and only Cheatum and Bozo remain. Moe and Curly were eliminated in the last round. Since it is now down to two people, the chances of success for either candidate are now 50-50. Who will win doesn’t matter for right now.
What This Means
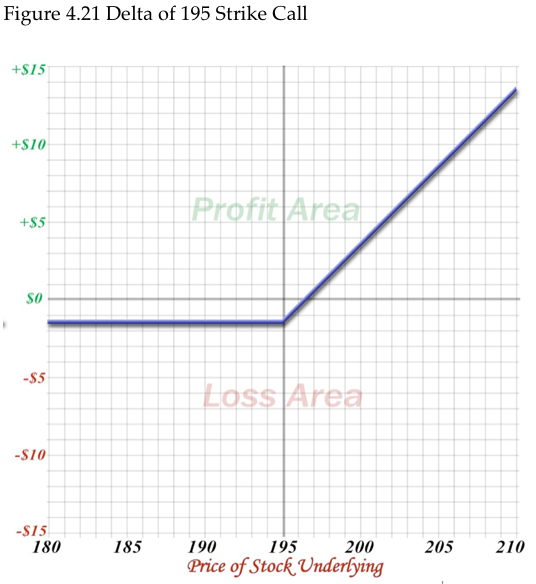
The same holds true with a stock option. Suppose that you own the 195 strike PEAR call when the stock was at $192. This call is slightly OTM, and the stock needs to run $3 higher (to $195) for the option to be ATM (at-the-money). We can say that the 195 call may have a delta, or a chance of being in-the-money on expiration, of 0.45 (stated as “45 deltas”).
When the stock moves to $195, it is now at the same place as the strike price, so the option has a “50 delta” (in math terms, it is 0.50).
And let’s say that the stock continues to move higher and gets up to $200. We own the right to buy PEAR at $195 per share (195 strike call). Everyone who does not own that call has to buy stock at $200, so we are better off by $5. Since the stock is $5 above the strike price, the odds of this option having intrinsic (real) value on expiration has to be above 50%. After all, the stock can fall $4.99 and the option will still be in-the-money on expiration.
As the stock moves, the chances of any particular option being ITM on expiration will change. Yet delta was a stationary number when we examined it earlier. We saw options with deltas of 0.60, 0.50, 0.45, etc., but did not take stock movement into account.
Option Gamma
Gamma is the measure of how much delta will change after the stock (index, commodity, futures, etc.) moves $1.
Right now, you do not have to understand how the probability of an option changes after the stock moves. You will understand better with practice. But for those who like to see the math, we will walk through the process the same way we previously did with delta.
Call Gamma
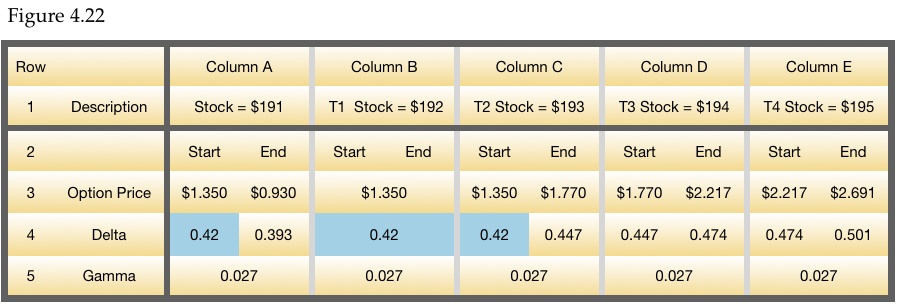
We know from the previous graph that the delta of the 195 strike call is 42 (0.42) when the stock is at $192. We can also see that the delta of the 195 call is 50 (0.50) when the stock is at $195. This means that the option has a gamma of 2.7 (written 0.027).
Be careful not to get confused here. Go through the following material slowly a couple times. Remember that gamma is delta’s rate of change, so until the stock moves, the gamma will not have any effect on the delta of the option. In other words, if you look below at column B, row 5, you will notice that the delta of the option starts and ends (column A, row 4 & column C, row 4) with a delta of 42 (written 0.42). (These areas have been highlighted to help you find them.)
Why is this like this?
When the stock is at $192, its option’s delta is 42 (0.42). It will not change until AFTER the stock has moved $1 in either direction. So when the stock moves from $192 to $193 (or $191), the delta is 42. Then when the stock is at $193, the probability has changed as the stock is now $1 closer to strike. It is at that point that the delta will change. So from $193 to $194, the delta will now be 44.7 (written 0.447) instead of 42.
So the big picture (going from a stock price of $192 to $195) looks like this.
- Time Period #1 (Stock at $192)
We know a couple of things. First, the call is starting at $1.35 in price and the stock is about to move higher. We also know that the delta of the option is 42 (0.42), so if the stock moves up $1, the call will increase by $0.42. And since the stock has not moved yet, the probability has not changed since this the starting price when we bought the call. The probability will not change until AFTER the stock has moved, thus we need not concern ourselves with gamma yet.
Once the stock moves, the call will move from $1.35 plus its $0.42 delta, so the ending price of the call will be $1.77 ($1.35 + $0.42).
- Time period #2 (Stock at $193)
Here we see that the stock has moved $1 higher to $193. The call has moved from $1.35 to $1.77. And since the stock has changed price and the probability of the stock closing in-the-money on expiration has changed, the delta will change too.
- Time Period #3 (Stock at $194)
For the next dollar move higher, the delta will be the 42 (0.42 written out) plus the gamma of 2.7 (0.027 written out). Thus the stock’s new delta will be 44.7 (0.447 written out mathematically). This means that, if the stock does move from the current price of $193 to $194 (as predicted), the call will move up $0.447 (instead of the previous $0.42).
- Time Period #4 (Stock at $195)
Process in Time Period #3 will repeat on the next dollar move higher. The stock is starting out at $194 and heading to $195. All of this will culminate in the call having a 50 delta (or 0.50 delta when it reaches $195).
Put Gamma
The same phenomenon is at work with puts as it is in calls, but in reverse. The lower the stock goes, the higher the delta of the put will become. Again, call deltas went up when the stock went up, and went down when the stock went down. Puts are the opposite. In addition, the same gamma principles apply. At the start of a stock price, you will not do anything with the option’s gamma until after the first $1 stock move.
Suggestion
Read this over slowly a couple of times while studying the previous chart. If this still confuses you, do not be discouraged. The information is a lot to digest at one time. Take solace in the fact that this is the most complicated thing you will learn about options, and that the other greeks are easier. If you find this frustrating, do not worry about it. It is not critical to your options education at this point, and you can come back to it when the other concepts have sunk in.
By that time you will likely be kicking yourself saying, “I don’t know why I made this out to be tougher than it is. This is just like a snowball getting larger and larger as it rolls down hill, or smaller if the movie is played in reverse.” You are almost there, so do not get discouraged now.
Long or Short Gamma
Greeks are not vital to your training right now, but when you start to get into portfolio management and sophisticated strategies, they will play a more important role. Right now it is only important that you understand why options move the way they do on a remedial level. It takes the mystery out of price movement, and gives you some degree of predictability.
In other words, it is nice to know what will happen to your option if the market moves $5 in one direction or the other.
So let’s leave it gamma section with this final thought. When you are buying an option, you are always buying gamma. This means that gamma is favorable to your position. The seller of an option does not want the option to move dramatically, thus we can say he has a short gamma position.
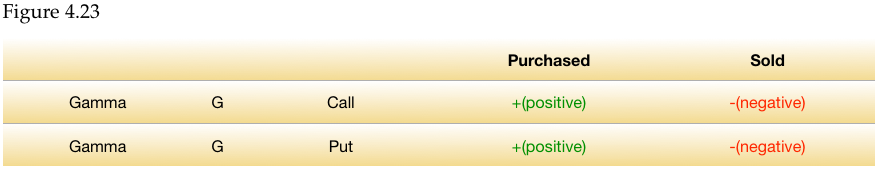
Do not confuse this with delta where calls have a positive delta and puts have a negative delta. Here we are talking about being long gamma, regardless of whether you purchase a call or a put of the option.
Vega
Vega is simply the measure of volatility. Any passive observer of the stock markets has a general idea that the markets are sometimes very calm and at other times very turbulent – things are never consistent. Vega attempts to quantify what “calm” and “chaotic” are in mathematical terms. Knowing exactly how much the market moves gives the trader a lot more information than just knowing that the Dow was down 200 points on Monday, up 120 points on Tuesday, down 410 points Wednesday, etc. Even if you do know those numbers, how do they compare with an average week in the markets? This is exactly what Vega is attempting to measure.
Vega Analogy
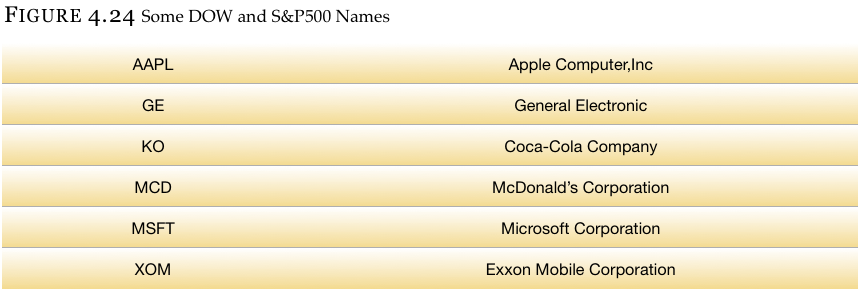
Today most analysts and reporters on the stock market look at a measure called the VIX – the Chicago Board Options Exchange Market Volatility Index. This is a fairly decent measure (about as good as one can get) of the overall market volatility since its measurements are derived from the S&P 500 index – an index that measures the largest 500 stocks in the US markets. This index is home to many of the Dow Jones Industrial Average’s household-name companies:
The measurement of the VIX is done in percentage terms to give a gauge of how much one can expect the market as a whole to move on a yearly basis. Most people look at a chart of the VIX, which can easily be found online at Yahoo Finance (symbol ^VIX) or on their broker’s website. If you go to the former site to look for a graph of the VIX, you will see something that looks as Figure 4.25:
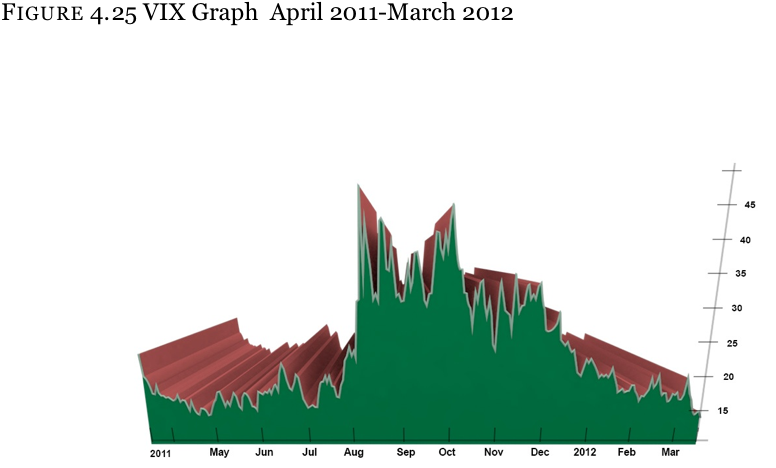
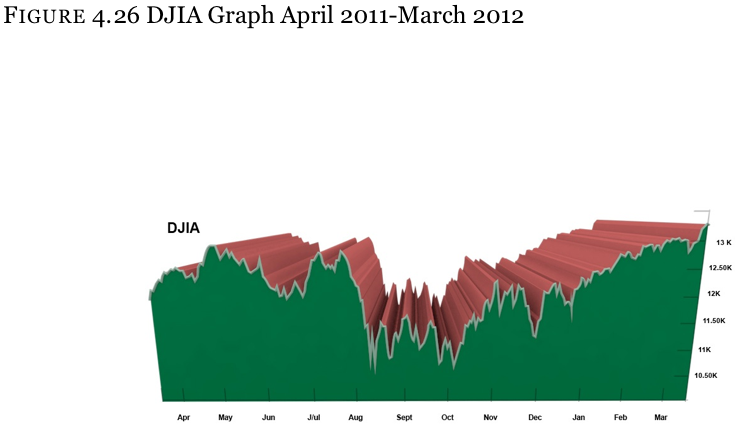
When the volatility, as measured by the VIX, was in the 30’s and 40’s (August through October), the markets were moving dramatically in both directions, but primarily down (these can be found as the Dow Jones Industrial averages in the lower chart). Meanwhile, at the start of October, the markets started to recover (move higher) and the VIX declined as things calmed down.
Fear and Greed
You may hear on television or read in the newspaper how an “expert” says that the markets are going to “go up 8% this year because of….” or down “20% because of….” The markets seldom move based on reasons, and even less seldom based on what some expert believes. The markets primarily move based on “fear” and “greed”.
Fear of losing money is often what causes the rapid declines. Everyone runs for the exits at the first real sign of the markets breaking. Greed is what causes bubbles. People throw caution to the wind when money seems to be too easy to make. They all want their share.
Option Vega
Option vega, also known as “implied volatility”, is the level of volatility measured in the price of an option (instead of stock).
Much earlier in the text we discussed how the three little pigs built homes but some did not plan well. The pig that made his home out of straw had high insurance rates when compared to the brick house pig. Why? Because the likelihood of the straw house having a strong wind knock it over was much greater than the house made of brick.
When I first heard this story at 5 or 6 years of age, I had no idea my parents were teaching me about the stock markets, especially considering they were clueless about investing. But in fact that is exactly what they were doing. We know that the straw house is going to be too expensive to insure because it has a relatively high chance of burning, falling, or blowing down. The same thing occurs with options. The higher the likelihood the stock can burn down, the greater the cost of insurance.
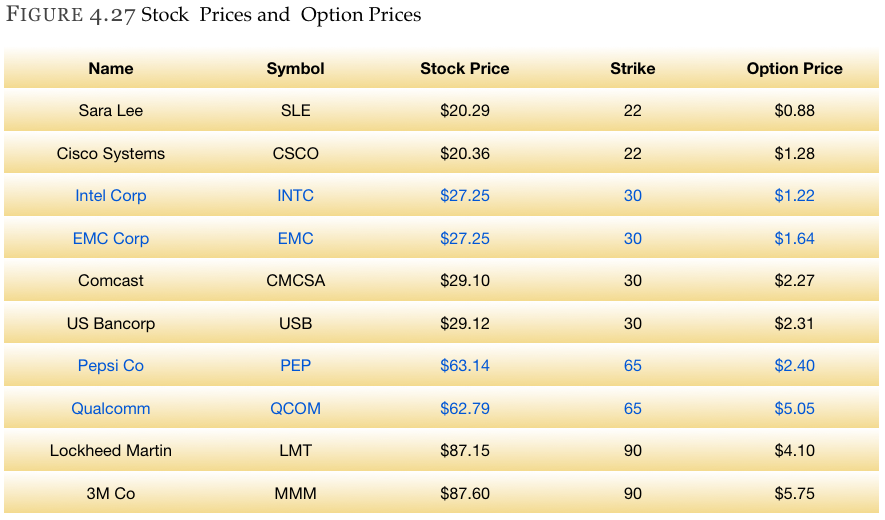
Recall Figure 4.27, where we had 10 different companies paired in twos with very similar stock prices. There was a wide variation in the stock option prices of the two companies paired together. They are trading at similar prices, with same option strike price, but dramatically different option prices. This was because of dramatically different volatility levels.
In Figures 4.28 and 4.29, you see a chart of Pepsi, Co. and Qualcomm for comparison purposes. Study them, looks can be deceiving.
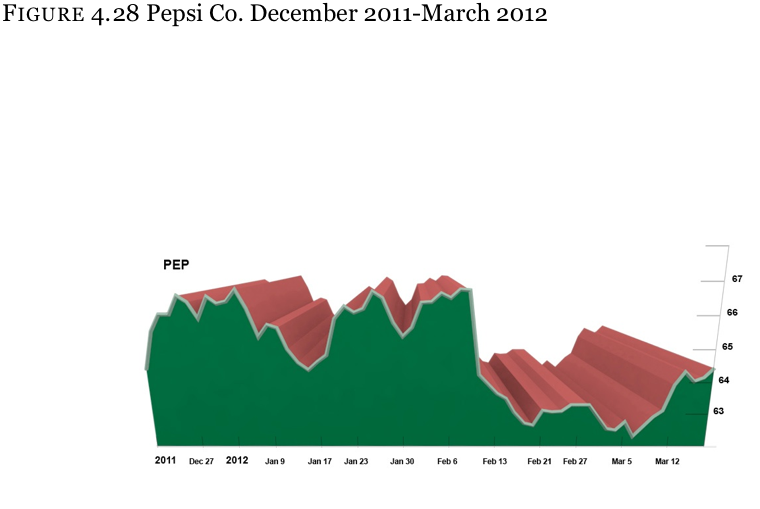
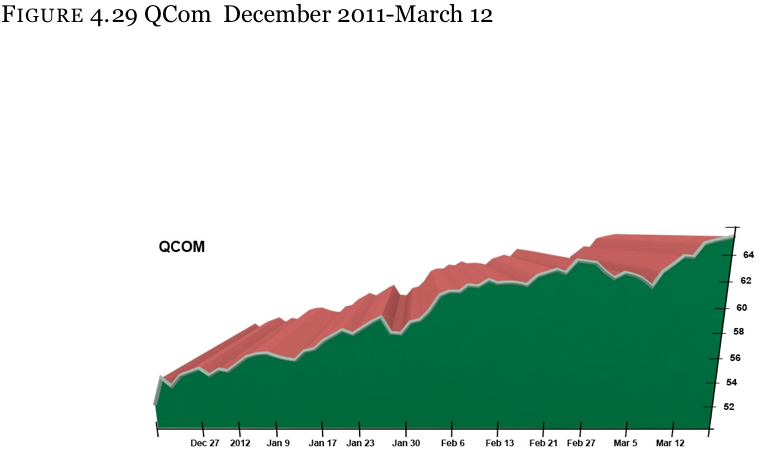
At first glance the Figure 4.28 might appear more chaotic, so you would think that the PEP stock would have higher priced options. But when looking at the charts in more detail you will see that the QCOM stock had a 3 month range of $52 to $64.5 ($12.5) while the PEP stock had a range of about $62 to $66.75 ($4.75). Comparing a stock that can move $4.75 in 3 months (PEP) to a stock that can move $12.50 in three months (QCOM) is not really a comparison. As the saying goes, “If the stock can go up $12.50 in 3 months, it can go down $12.5 in 3 months.” This is why the QCOM call is trading for $5.05 while the PEP option is only trading for $2.40.
Definition
Vega is the measure of the amount an option will change in price when the volatility of the stock changes 1 point.
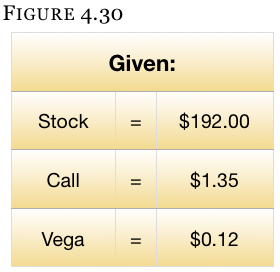
Say that we are looking at PEAR and notice that the 195 call is trading at $1.35. Suppose that the vega in the PEAR 195 call option is 12 (written 0.12, or $0.12). If volatility in this stock moves up 1 percentage point (from say 18.2% to 19.2% – explained in a moment) and all other variables remain constant, then this option will increase in value by $0.12 (to $1.47). Had the volatility declined 1% instead, the option would have moved from $1.35 to $1.23 ($1.35 start price – 1 vega of $0.12).
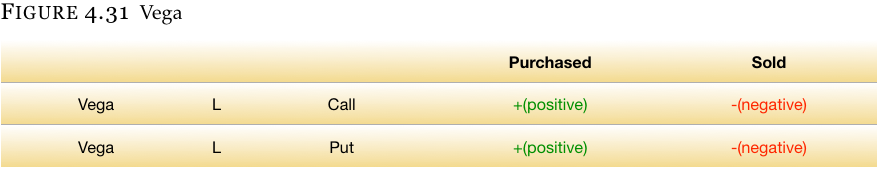
Important Notes
But the only thing someone new to options should know about vega is that he is buying vega when he buys an option. This means that if you own an option and volatility increases, this increased level of volatility is beneficial since the option can now be sold on a higher level of volatility.
If a seller of an option has sold vega, then an increase in volatility means the spike in implied volatility levels will be moving against him. On the other hand, if a seller of an option sees volatility decline, this is an advantage.[/ezcol_2third]
 [/ezcol_1third_end]
Theta
This is the measure of how much an option loses because of one day of time decay.
Theta Analogy
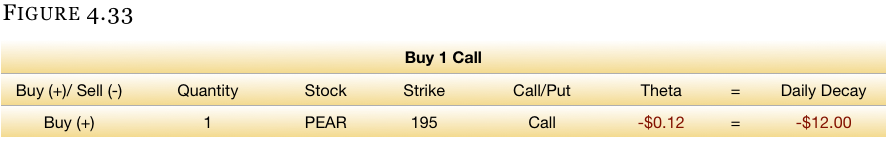
Recall that, when we bought the PEAR 195 call for $1.35, the stock was at
$192. This means that the call was out-of-the-money and had to move higher by more than $3 to get intrinsic (real) value. The whole $1.35 of the option price was time value.
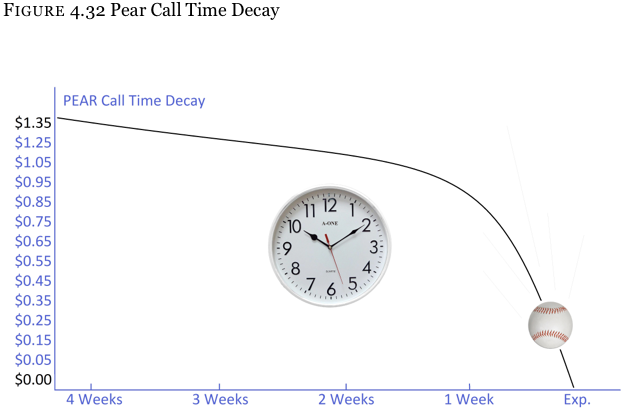
Because options eventually all lose time value (whether they are worth something on expiration or not), the time value erodes a little bit every day – just like your automobile loses value every day. Your car will lose the most value the day you pull it out of the lot (the first day). Meanwhile options lose the most value on the last day of trading.
Many people think that if an option has $1.35 of time value and there are 27 days until expiration, the option loses $0.05 a day ($1.35 divided by 27 days = $0.05). In reality, since options are priced based on the probability of them being in-the-money on expiration, the option erodes faster with less time. Technically speaking, for any engineers reading this, the time decay of an option is the function of the square root of time. What? Don’t worry about it. First, it is not as complicated as it sounds, and second, it is not important.
Think of a baseball being thrown hard and eventually landing on sand (so it doesn’t roll). You have a fairly good idea of how time decay works. Here is the time decay graph of a PEAR 195 call.
Important Notes
Always remember that when you buy an option you are paying for the time the option has remaining until expiration – you are paying for opportunity. Part (or all) of that opportunity cost is going to be time value which eventually goes away.
So when you purchase a call or put, the time decay is going against you. This is why time decay is a negative number for the buyer and a positive number for the seller.
Request Video of Option Basic Seminar ? Click here
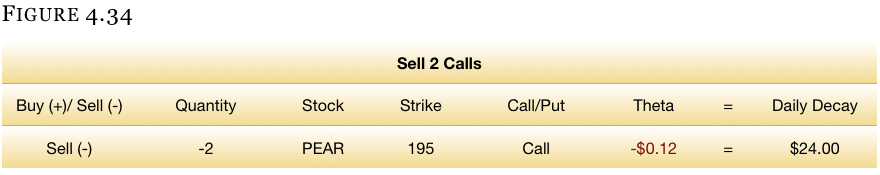
Example:
Let’s look at the purchase of 1 contract and the sale of 2 contracts separately.
Rho
Rho is the measure of the amount an option will move when interest rates change by 1%. The good news for you as a trader is that rho is almost always minimized or ignored. Interest rates do not move that much, and when they do, only long term options are usually affected.
The other piece of good news about rho is that it works the same way as gamma and vega, so there is nothing else to learn about this.
Greek Graphs
The stock market is an unpredictable entity; it has the same chance of going down as it does going up. The long term bias to the upside of the markets is somewhat of a myth, or at least greatly over-exaggerated.
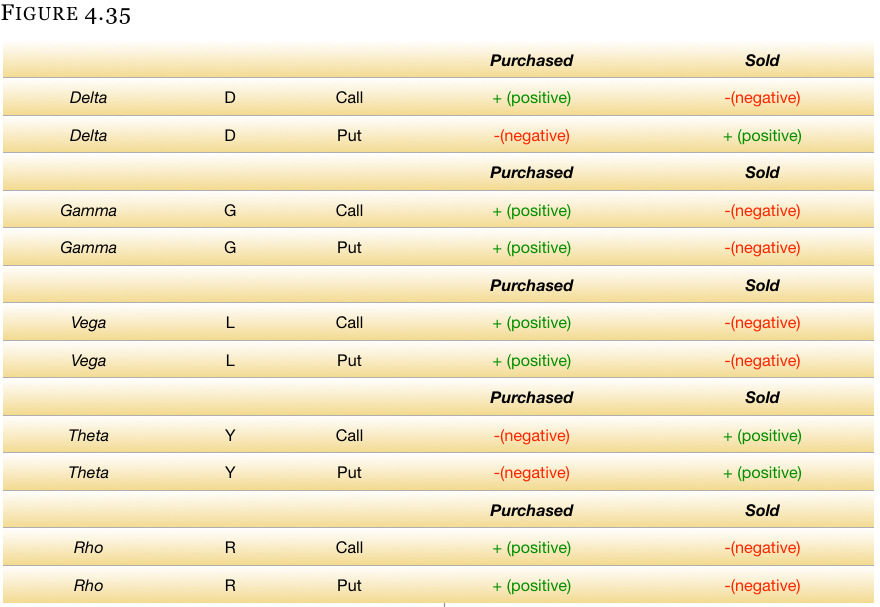
Greek Summary
Figure 4.35 below is a quick recap of the greeks. You might find it helpful to copy this section and look at it time-to-time until it sinks in.
We want to emphasize once again not to get hung up on understanding the greeks perfectly. The concepts will slowly absorb with time. Having a general understanding of the influences that affect the price of an option will help you learn trading strategies. With time, you will find yourself becoming a master of the greeks without even trying.
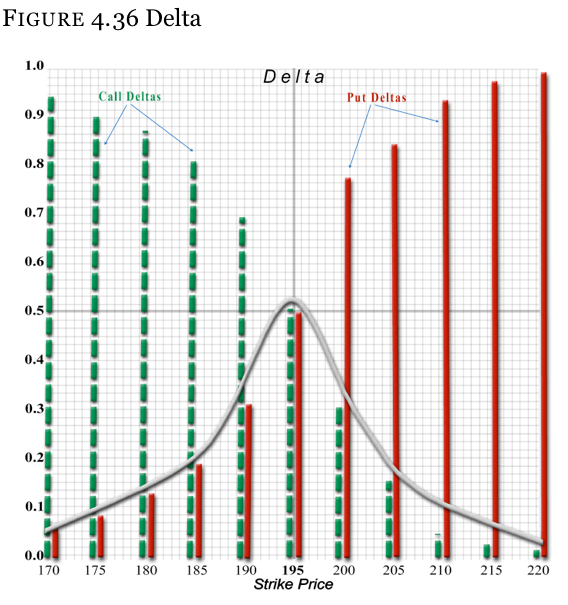
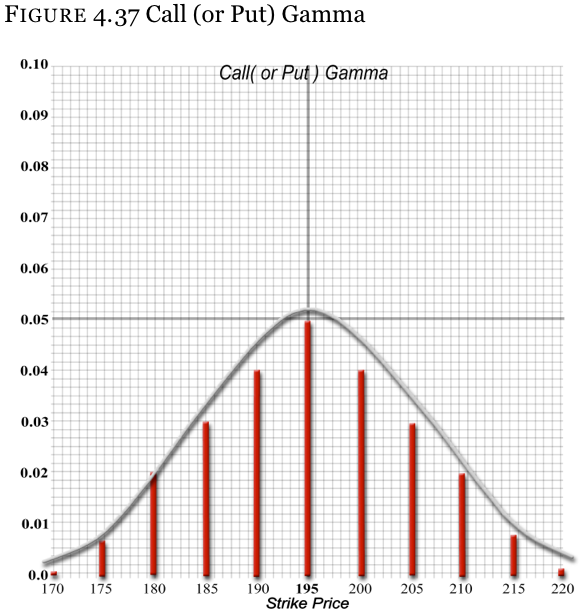
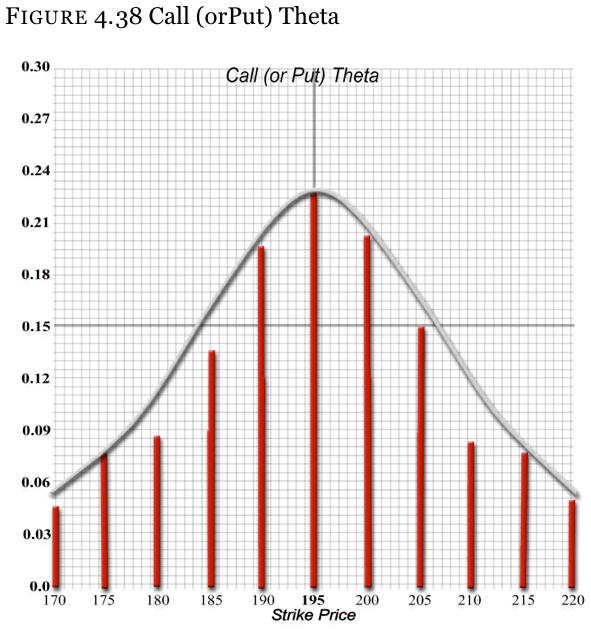
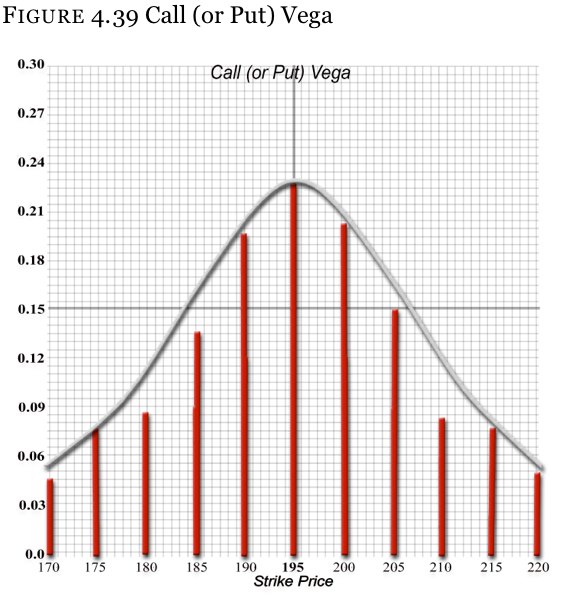
Extra Credit
Eventually you will move further along into your study of the greeks and remedial probabilities.
Just as a preview, look at the following Figures 4.36-39 and you will see a recurring theme. Because the markets move in a random fashion (hence Random Walk), the greeks and option premiums fall under a normal distribution curve. Don’t get stressed out about this. We will have a remedial explanation for you.