< Options
So far you have learned most of what there is to know about an option, and though you still may be a tad overwhelmed by the new terminologies, the repetition eventually create a working knowledge and become second nature in no time. So now let’s go into the practical applications of how options work (instead of what their contract specifications are)
Request Video of Option Basic Seminar ? Click here
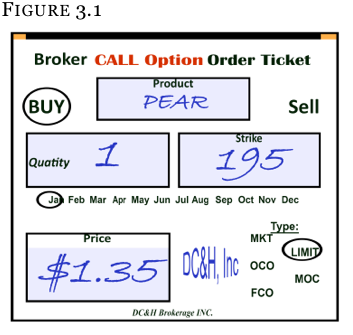
Starting with the PEAR call we have been looking at so far, we know several things about this call option. We know the expiration (3rd Friday of January), we know how many shares it controls (100 shares), we know where we can buy the stock ($195 per share), and we know how much 1 contract will cost us ($135).
What we do NOT know is how this option moves between now and expiration as the stock vacillates. For this we need to introduce you to a profit-and-loss chart (known as a “PNL chart”) for this particular option.
Figure3.2 shows what this option will look like on expiration for any given stock price. We will state this one more time for emphasis: This PNL chart is at the moment of expiration, where no time is left and the time value has vanished. The option will either have intrinsic value or it will not (depending on the price of the stock).
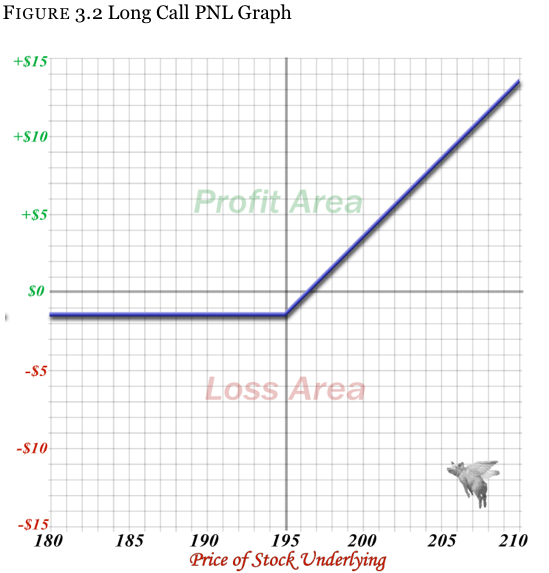
To read this graph all you have to do is determine what stock price you want to see (horizontal line) and follow it up to see what the option is worth. If you want to know what the option will be worth if the stock closes at $200 per share, all you have to do is find $200 on the bottom horizontal line and proceed up until you hit the line that presents the call option.
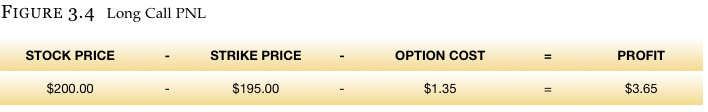
Follow the $200 line up horizontally until you get to the call option graph. From there, proceed to the left and see that the option is worth $3.65 on expiration.
The math works out as Figure 3.4:
- One
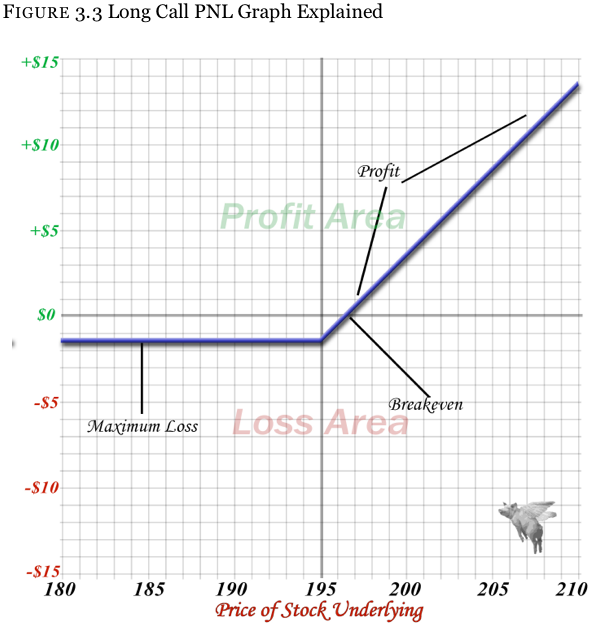
The most that can be lost on the option is what was paid – $1.35 on this particular option. Even if the stock falls to zero, the call cannot lose more than the original investment.
- Two
The call moves high on a dollar for dollar basis with the stock once the stock price breaks through the strike price (195 with this option).
- Three
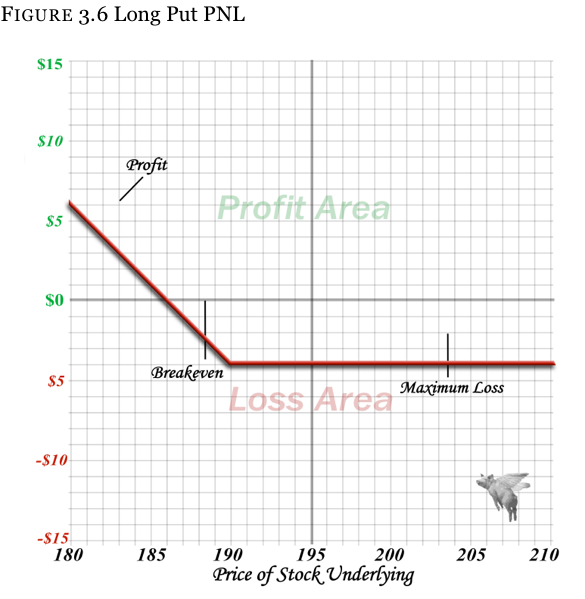
You will notice a designation of “break-even” on the graph. This is the price where the stock has advanced enough (or fallen enough with put options) to make back the cost of the option, but no additional profit is made. Anything beyond the break-even point is a profit.
A graph for the purchase of a call option can dramatically enhance your understanding of what happens to an option on expiration – and the same is true for a put option. Calls are a bullish position that make money as the stock advances, so we can expect to see the graph of a put option (which is a bearish position) make money as the stock declines in price.
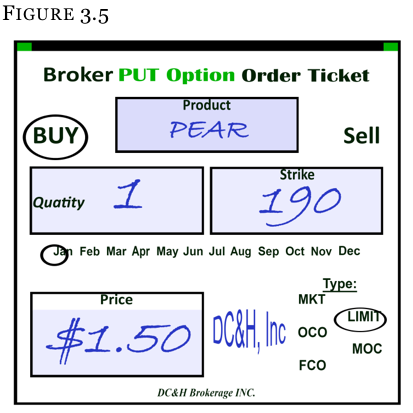
Our put option in PEAR can also be graphed out. You will notice that it looks like an almost exact opposite of the call option.
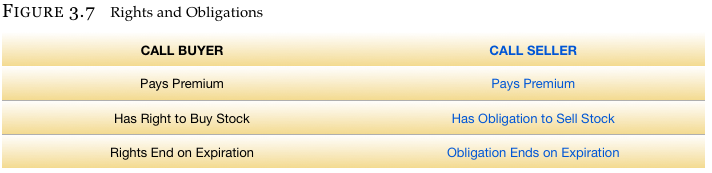
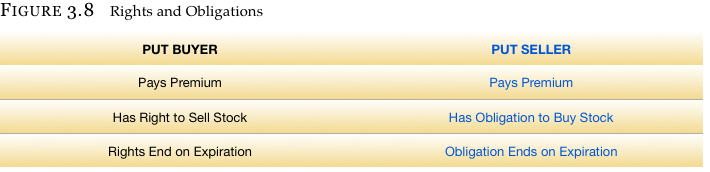
Up to this point, we have only discussed the purchase of options (though we did touch on the short sale of stock). Whenever someone buys a stock, someone has to sell it to them. There is not a shelf of stock somewhere from which your broker just grabs what you need. The same thing works in the options world. For every buyer of an option, there is a seller.
When you buy a call option because you think the stock is going to move higher, someone sold you that call because he thought the stock was going down (or at least not going any higher).
When you bought the option, you paid a premium for the right to buy the stock. The seller of the option collected that premium, but has the obligation to sell the stock. Again, the buyer has the rights and the seller has the obligation if/when the buyer wants to exercise his right.
The same exact thing is at work with put options as well. Any put that is purchased is only done when someone who wants to sell a put at the same time. The same rights and obligations apply.
And just like the purchase of an option can be graphed out, the sale of an option can be graphed out as well. Below is the graph of the call option we bought for $1.35 from the seller’s perspective. As you probably can guess, it looks like the buy, but just
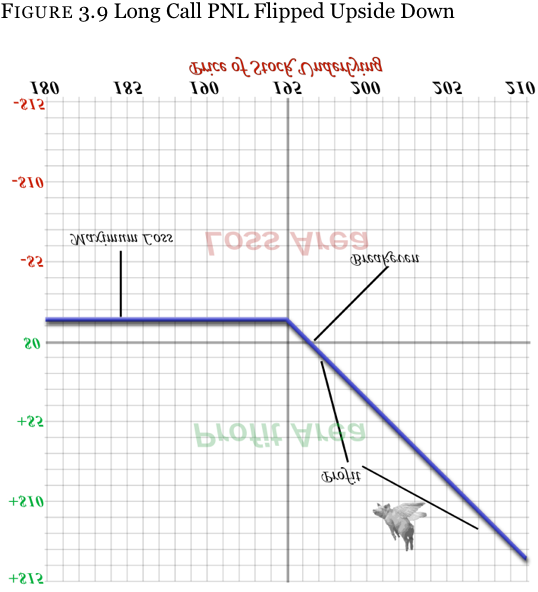
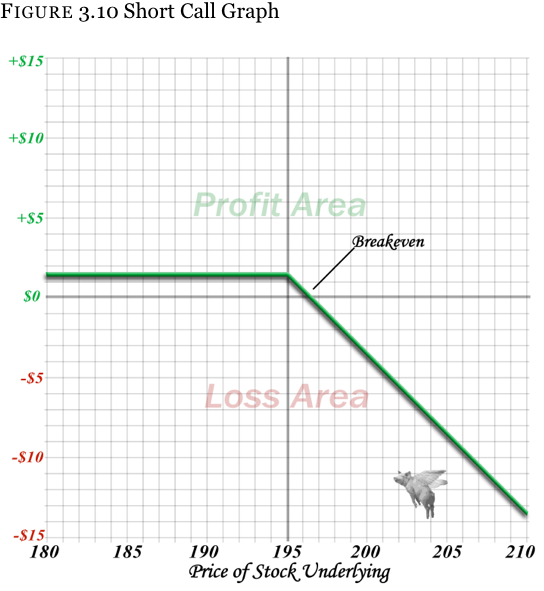
The same holds true with the short put. If you simply invert the image of the long put, you will see the graph for the person who sold the put to the buyer. This may not make sense at first, but you will understand it better once you realize that you are both on opposite sides of the same coin.
Figure 3.11 illustrates the profit-and-loss comparison between the purchase of an option and the sale of an option at varying stock prices at expiration. The highlighted areas are the numbers to focus on as this is the dollar profit or loss on the option from the simultaneous perspective of the buyer and the seller.
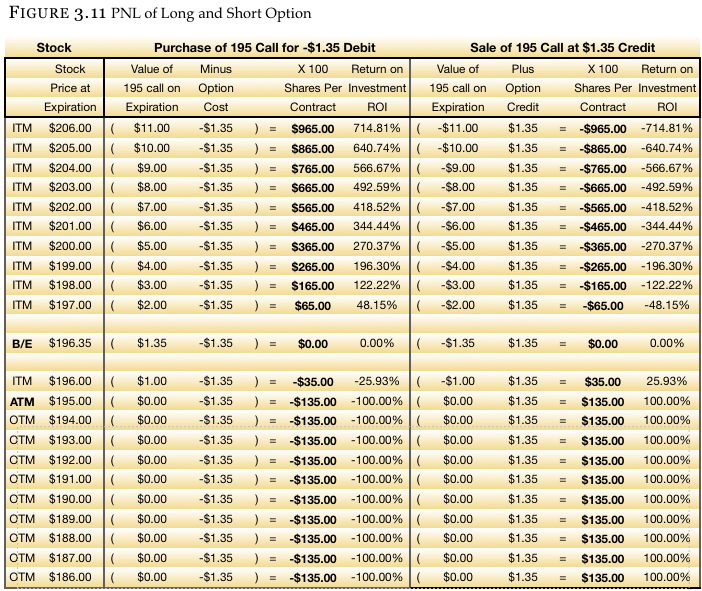
The PNL graphs we have been looking at are also known as “break-even charts”. These charts only show what an option looks like at EXPIRATION. You will notice that if the stock were at $195 and you bought the 195 call for $1.35, the chart would show a $1.35 loss. Again, that is after much time has passed and it is the moment of expiration.
But what happens between the time you bought the call (or put) and when the stock moves? Certainly it would make sense that if you purchase a bullish position and the stock moves higher, then the price of the option moves higher as well. This assumption is how options typically move. Thus, showing a chart of the option’s break-even point on expiration may be a tad misleading for what the option would do if the stock moved immediately.
So what happens to an option when you go out and buy (or sell) a call or put?
Let’s say that we bought the 195 call (the option that allows you to buy stock at $195 per share regardless of where the stock is trading), and the stock immediately had news come out. The news could be good news for the stock, or it could be bad.
Because traders are eternal optimists, let’s start out with what would happen if the stock went up $10. We will then look at what happens if the stock fell $10 instead.
Request Video of Option Basic Seminar ? Click here
When we initially addressed this option a few pages earlier, we saw that PEAR stock was trading at $192. It was at this stock price that the 195 strike call was trading for $1.35. We followed this up by seeing what would happen to the option as time passed until expiration. We will now address what happens if the stock moves higher as we anticipated.
If the stock moves $10 higher from $192, it will be trading at $202, and we want to have an idea where the call will be trading. There are a couple of ways to figure out the answer, but since this is an introduction, we will think through this logically.
We know that options are made up of time value and intrinsic value. We also know that an option cannot trade below intrinsic value. In other words, if we have the right to buy the stock for $195 (the strike price) when the rest of the world would have to pay $202, we are $7 better off than everyone else so the call will have $7 of intrinsic value. As a matter of fact, the option has to be trading for at least $7 and will be trading for even more because there is still time remaining until expiration (which has value as well).
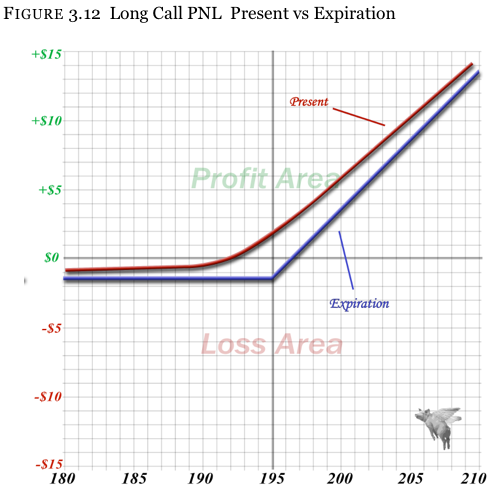
The Figure 3.12 is one that you previously saw as the break-even / PNL graph at expiration, except another curved line has been added to represent the option prior to expiration. The bottom line is the line representing how the option will look at expiration, while the line above it shows what this option will look like at the current moment.
As time until expiration approaches, the top line (current time) will begin to fall towards the bottom break-even line (expiration)
You have seen how the call option works prior to expiration. The same type of chart be created for a put, as well as virtually any other position.
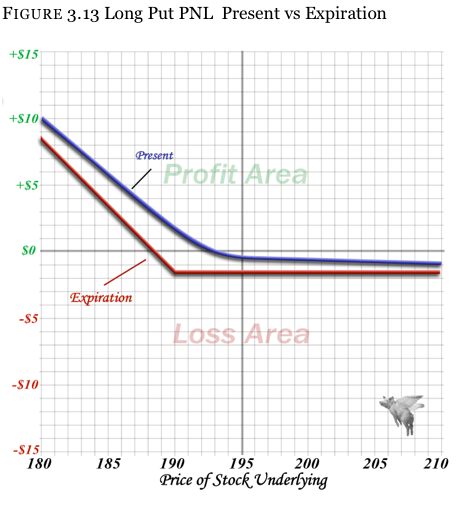
For you to get a better understanding of these present and future PNL charts, the long put option at the 190 strike purchased for $1.50 should help you learn through repetition.
If the stock starts at $192 and the market falls $10, the ending stock price will be $182. Since we own the 190 strike put (which gives us the right to sell the stock at $190 anytime), we will at least be $8 better off than people who have to sell stock at $182. Thus, we will have an intrinsic value of $8, and the option has to be trading for at least $8. But we will also have a little time value in the options as there is still time until expiration. The present and future PNL chart looks as Figure 3.13: