Objective: To profit from a stock that stays in a range.
Definition: A long butterfly may be constructed in one of two ways:
1) It consists of purchasing ONE call, selling TWO calls at a higher strike, and purchasing ONE call at an even higher strike all having the same expiration date. The distances between the strikes are the same. Example: Buy ONE January 95 call for ($8) sell TWO of the January 100 calls at $5, and buy ONE January 105 call for $3 for a net debit of ($1).
This gives you a net overall debit of $1 ($8 – 2x $5 + $3 = $8 – $10 + $3 = $1). This formula works regardless of the underlying’s price.
2) OR purchasing ONE put, selling TWO puts at a lower strike, and purchasing ONE put at an even lower strike all having the same expiration date. The distances between the strikes are the same. Example: Buy ONE January 105 put for ($8) sell TWO of the January 100 puts at $5, and buy ONE January 95 put for $3 for a net debit of ($1).
This gives you a net overall debit of $1 ($8 – 2x $5 + $3 = $8 – $10 + $3 = $1). This formula works regardless of the underlying’s price.
Note 1: The value of the call butterfly is equal to the value of the put butterfly of the same strikes and expiration date.
Note 2: The above call butterfly may also be thought of as the purchase of the 95/100 call spread and the sale of the 100/105 call spread.
By the same logic, the above put butterfly can be thought of as the purchase of the 105/100 put spread and the sale of the 100/90 put spread.
Maximum Risk: The original cost
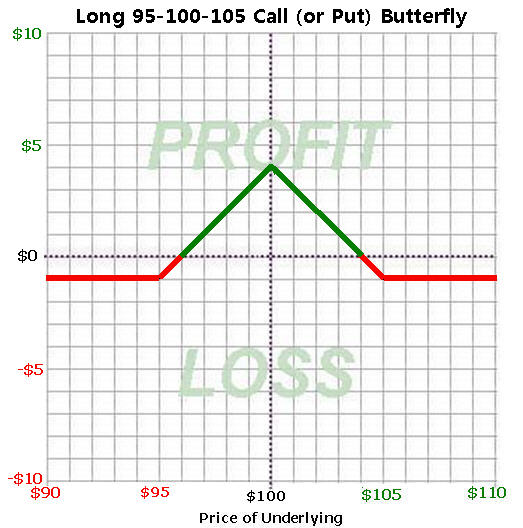
Maximum Profit: Equal to the distance between any two adjacent strikes LESS the debit paid. [95-100- 105 butterfly bought for $1 has a distance of $5 per adjacent strikes. Max profit then = $5 – $1 debit =$4.
Benefits: Butterflies can become profitable strategies in the case where traders feel that a stock is going to remain in a range close to the middle strike.
Break-even (B/E): These are the prices the stock must remain between at expiration for the trade to break-even. In a long butterfly, there are TWO Break-even points. The upside break-even is equal to the higher strike price less the premium paid. The lower break-even is equal to the lower strike price plus the premium paid.
If you bought the 95-100-105 butterfly for $1, the B/E levels would be $96 and $104 (95 strike + $1 or 105 strike – $1).
If the stock closes at expiration between the B/E levels, a profit will occur. If the stock closes beyond either B/E on expiration a loss occurs.
| Long Butterfly Profit and Loss | |||||||||
| Stock Price | Long 95/100 Call Spread | – | Short 100/105 Call Spread | = | Spread Value | – | Cost | = | Profit or Loss |
| 150 | $5.00 | – | $5.00 | = | $0.00 | – | $1.00 | = | ($1.00) |
| 110 | $5.00 | – | $5.00 | = | $0.00 | – | $1.00 | = | ($1.00) |
| 107 | $5.00 | – | $5.00 | = | $0.00 | – | $1.00 | = | ($1.00) |
| 106 | $5.00 | – | $5.00 | = | $0.00 | – | $1.00 | = | ($1.00) |
| 105 | $5.00 | – | $5.00 | = | $0.00 | – | $1.00 | = | ($1.00) |
| 104 | $5.00 | – | $4.00 | = | $1.00 | – | $1.00 | = | $0.00 |
| 102 | $5.00 | – | $2.00 | = | $3.00 | – | $1.00 | = | $2.00 |
| 100 | $5.00 | – | $0.00 | = | $5.00 | – | $1.00 | = | $4.00 |
| 98 | $3.00 | – | $0.00 | = | $3.00 | – | $1.00 | = | $2.00 |
| 96 | $1.00 | – | $0.00 | = | $1.00 | – | $1.00 | = | $0.00 |
| 95 | $0.00 | – | $0.00 | = | $0.00 | – | $1.00 | = | ($1.00) |
| 94 | $0.00 | – | $0.00 | = | $0.00 | – | $1.00 | = | ($1.00) |
| 90 | $0.00 | – | $0.00 | = | $0.00 | – | $1.00 | = | ($1.00) |
| 80 | $0.00 | – | $0.00 | = | $0.00 | – | $1.00 | = | ($1.00) |
| 50 | $0.00 | – | $0.00 | = | $0.00 | – | $1.00 | = | ($1.00) |
Many have an easier time understanding strategies when looking at profit and loss graphs. The graph below shows what the Butterfly looks like.

