
Our Books:
All Four Books
 Liquid Book
 One Strategy for All Markets
 Option Greek for Profit
 Options Platinum
 Practicals
 Stock Options and Collars
 Time Spreads
Online Training:
 Practical Options Trading
Online Courses: 1-5 Remedial Videos
 BWB in 3 hours
 Collars Mini-Course
 Condor Copia Mini Course Recording
 Online Platinum Class Recording
 Part-Time Trading Mini Course
 Scalping Class Recording
Videos & Books:
 50/50 Video and Book
 Essentials Home Study Kit
 Practicals Home Study Kit
Live Events: Caribbean Cruise Seminar
 Italy Seminar
[/ezcol_1quarter]
Vertical spreads are designed for trading in more subdued and normal market conditions. Yes, markets can move quickly and strongly in one direction, but under most circumstances, the markets do not move much from one month to the next. This is where a vertical spread can triumph over a naked option in both risk exposure and return on investment.
TOP OF PAGE
Request Video of Option Basic Seminar ? Click here
Long Call Vertical Spread Analogy
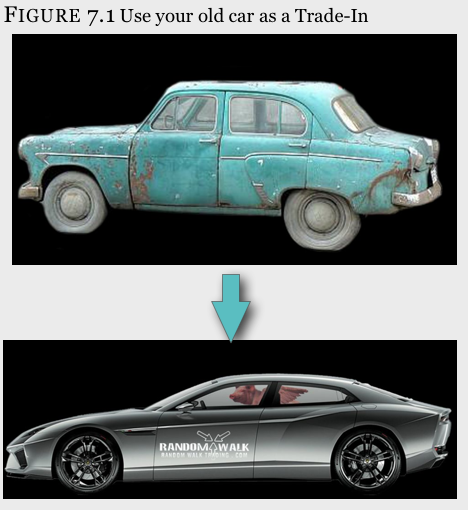
Suppose you had your eye on a very fast and sleek new car from Random Walk Motors, but the vehicle cost $70,000 – about $20,000 more than you had in your budget. Despite the cost, you just have to have it, and it is easy to rationalize.
The solution? Use your old car as a trade in.
You will simply find a dealer who will take $20,000 for your slightly used 1978 vintage vehicle that you only drove to the races on the weekends. The $70,000 list price of the car minus your $20,000 trade-in will bring the cost down to what you can afford – $50,000. This is the same exact thing as a call or put spread, but instead of buying the car you want and sacrificing your old car, you will buy the call you want and sell a call that you think is so far out-of-the-money that the stock can’t reach it.
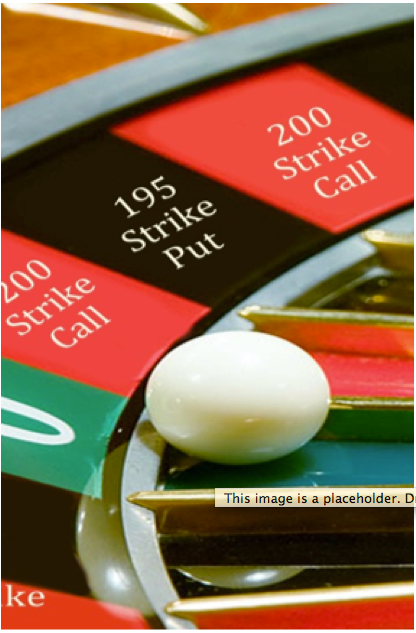
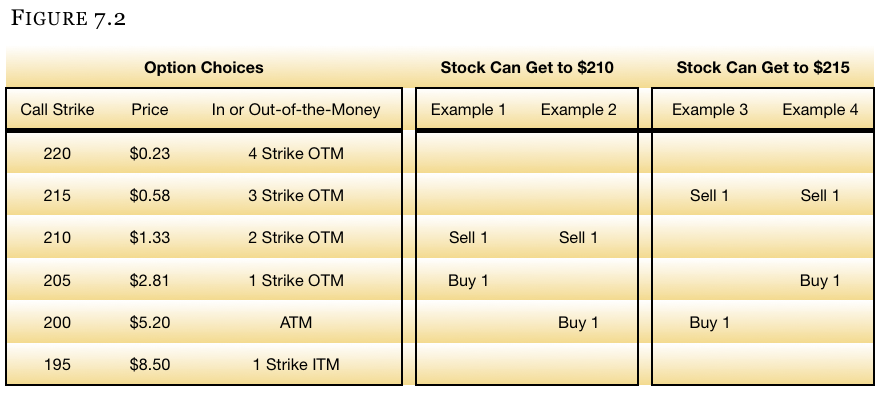
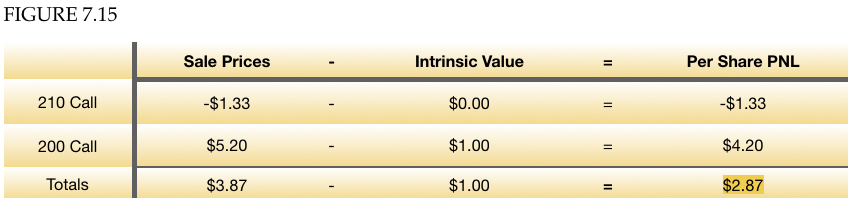
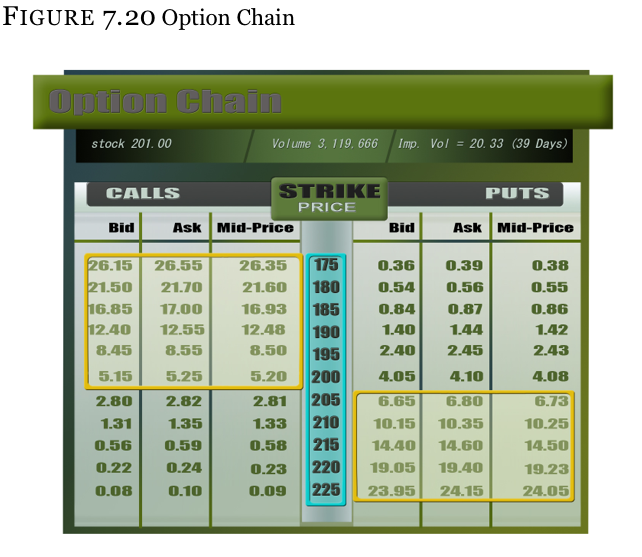
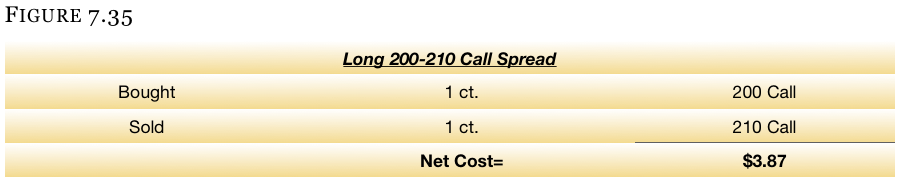
For example, suppose that you think the stock can go no higher than $210 by expiration with the stock currently at $201. All you have to do is purchase the call that you would want to buy normally, and then sell the $210 call to help offset the price.
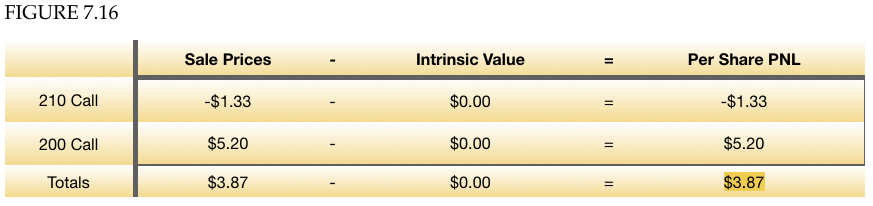
Looking at Figure 7.2 (specifically in example #2) you will notice that, if you elected to buy the 200 strike call, it would cost you $5.20. By selling the 210 strike call against it, you will receive $1.33. The debit from the 200 call purchase minus the credit from the sale of the 210 call will result in a spread that costs only $3.87 ($5.20 – $1.33). This is an investment of $387 per spread, which comes out to be a 26% discount compared to having to pay for the naked long 200 strike call.
Definition
A long vertical spread is the purchase of a call (or put) and the simultaneous sale of a further out-of-the-money call (or put) in the same expiration month.
Graph
In chapter 5 on naked option purchases and sales, we introduced the profit and loss (PNL) graphs as a tool for picturing how the options move throughout the entire spectrum of possible stock prices on expiration. This same graph is now brought back to illustrate what a vertical spread looks like.
Figure 7.4 is a graph of the long 200 strike call, short 210 call, and the graph of the vertical spread (the two calls combined).
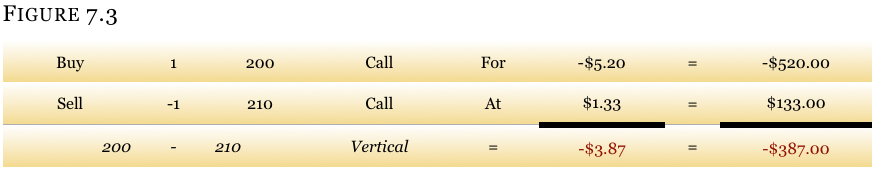
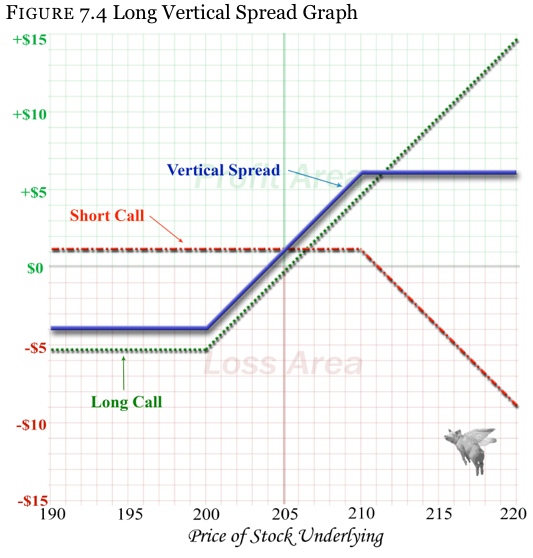
Figure 7.5 is how the long vertical call spread purchased for $3.87 looks as the stock moves up or down at the time of expiration (when all the time value is gone)
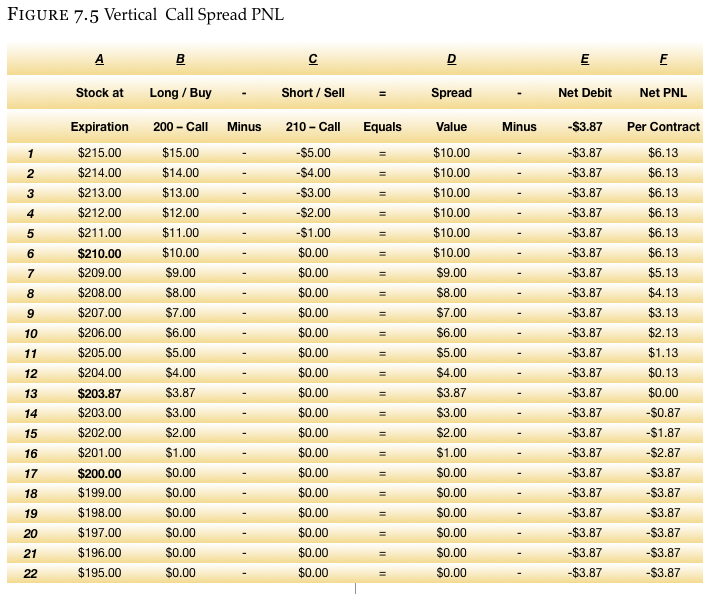
Vertical Call Spread PNL Explained
The Figure 7.5 table provides a lot of detail about the 200 – 210 call spread.
- Column A
This column is a list of possible stock prices at expiration. Though it is not inclusive of all possible closing prices, it has a $5 range above and below the strikes of the vertical.
- Column B
This is the value of the 200 strike call at expiration given the closing price in column A. It does not have the price of the option paid in it as that is covered in the “net debit” column (column E).
- Column C
This is the value of the 210 strike call at expiration.
- Column D
This is the value of the spread (200 call – 210 call) at expiration – not including the cost of the spread. You will notice that the value of the spread where the strike prices are $10 apart (210 and 200) maxes out at $10, and goes down to zero.
Also notice that the maximum profit is made at the strike price sold – the 210 strike in this example (column D, row 6). If the stock continues higher to $211, $212….$215, the same $10 profit is made.
- Column E
Net Debit column is the amount paid for the spread.
- Column F
This is the net profit or loss of the spread at expiration after the cost of the spread.
We already saw how the vertical call spread works as the price of the stock/underlying moves up or down. Yet this does not address the benefit of the spread completely. Yes, we saw that buying the vertical spread instead of the naked 200 strike call will save you 24% on your investment costs and risk, but you are giving up the unlimited upside potential that the naked long call has. Even so, a stronger argument can be made for the vertical spread rather than the naked call.
The vertical spread will be of tremendous advantage over most normal market conditions as we will see below when we compare the amount that the stock has to move for the naked long call to outperform the vertical spread.
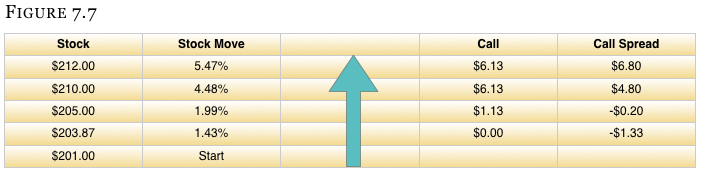
In Figure 7.6 please notice how the two shaded areas compare to one another. The first shaded area is that of the call spread’s net profit or loss as shown in the previous table. The second shaded area (on the right) is the profit or loss on the naked long 200 strike call purchased for $5.20. There are, however, a few important observations that should be made.
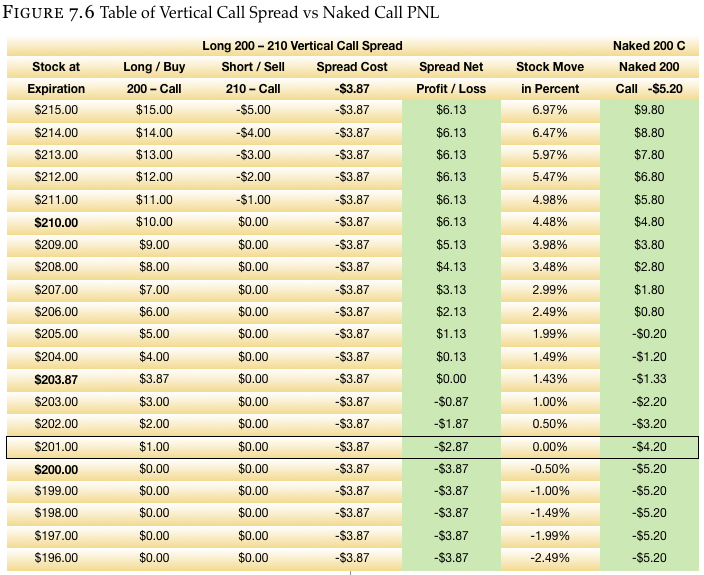
- Observation 1
We can see that the spread breaks even at $203.87 when the stock is only up 1.43%. Yet at the same price, the naked long call closes out at a $1.33 loss. At this price, the vertical spread outperforms the naked long option, but let’s continue going up in stock price.
- Observation 2
If you move up the stock price to a point where the naked call roughly breaks even (for our case, we will call it a stock price of $205), we see that the call spread is at a profit of $1.13, even though the naked call is roughly at a break-even point (-$0.20). Again, the call spread is showing an advantage to the naked call, but we must keep moving up in share price to get a fair comparison.
- Observation 3
Looking at a stock price of $210 per share which is $9 higher from the start price of $201, we see that the vertical spread is up $6.13 and the naked call has a profit of only $4.80. The stock had to run up almost 4.5% in one month’s time, and the vertical spread still beat the naked call. As with the previous examples, let’s keep moving up the price of the stock to see where the two trades are at parity.
- Observation 4
The stock price must move up to $212 for the naked call to outperform the vertical spread. Then, after the call spread maxes out, the naked call will continue to make money as the stock moves higher. Yet this is an $11 run higher and a 5.5% rise in the price of the stock. As tempting as it sounds to own the naked call, how often does a stock move up more than 5% in a month? Under most circumstances the call spread will outperform the naked long call.
Request Video of Option Basic Seminar ? Click here
Selling Call Analogy
We previously touched on this when we were looking at remedial stock and option basics, but this is often where a few people begin to have questions about the vertical spread. Many people ask, “How can you just go and sell the 210 call if you never bought it in the first place?”
[ezcol_2third]We called it “selling short” in the stock section’s examples. And it is the same thing as buying a call option and selling it later, but in reverse.
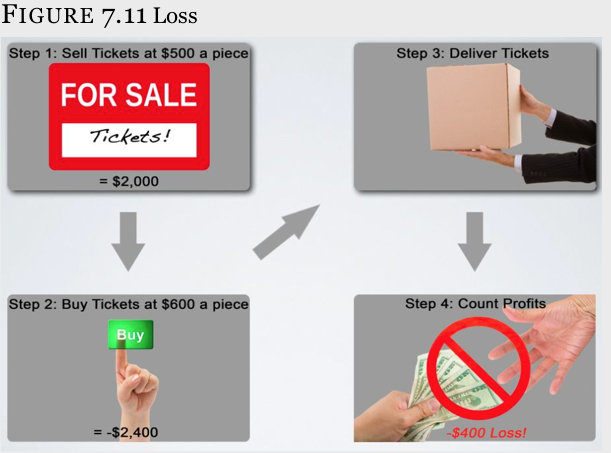
Think of selling a call you don’t own like selling a concert ticket to a distant acquaintance. You notice a sign on the public bulletin board at the local grocery store saying, “4 Pink Floyd Tickets – $300 Each.” Later in the day you bump into this guy you know from a friend of a friend, and he says “Do you know anyone that has tickets to tonight’s Floyd concert, man? Dude, I would pay like $500 each for up to four tickets.” Let’s call your acquaintance Abbey Normal.
[/ezcol_2third] [ezcol_1third_end]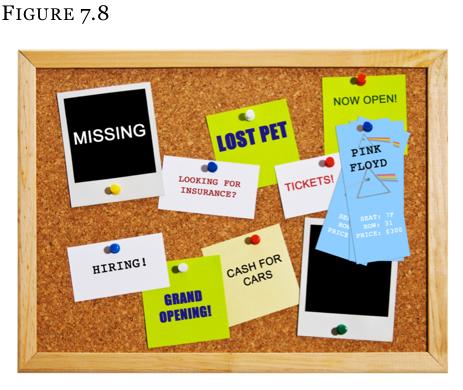 [/ezcol_1third_end]Since you don’t particularly care for Abbey and because you need the money, you tell him, “I can get you 4 tickets.” This should be an easy $200 profit on each ticket. You remember the sign at the store and you will call the guy to get the ticket. Once you have the tickets you will give them to Abbey.
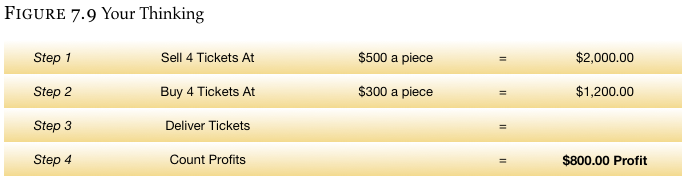
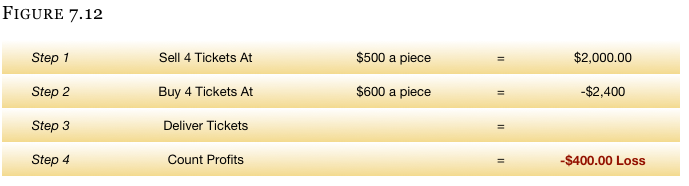
So you take the money from Abbey and set off on your journey after promising him you will get the tickets. You now have to deliver the tickets. If you can get the tickets from the individual selling them on the bulletin board your day is easy and you have an $800 profit ($200 for each of the 4 tickets). If the guy selling the tickets on the board cannot be reached or has sold the tickets, you have to figure out real quick how to get 4 tickets.
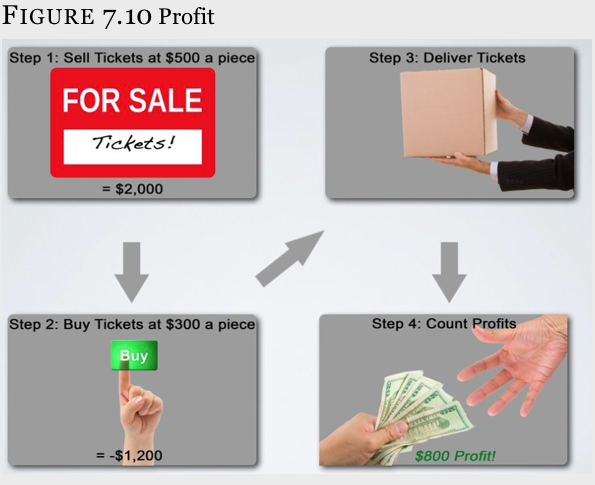
Worse yet, if you don’t get the tickets from the guy posting the advertisement on the bulletin board, you might have to pay more than $500 per ticket from someone else, thus you might be facing a loss. If the only place you can find tickets is from a guy selling them at $600 per ticket and you took in $500, you will have to deliver the tickets nonetheless. This will result in a $400 loss to you ($100 per ticket). Yet it is a risk you decided to take.
Maximum Profit
As you might have gathered by this time, the maximum that can be made on a vertical spread is the distance between the strikes – minus what you paid for the spread. In the example we have been using, we bought a spread that was $10 wide (bought the 200 strike and sold the 210 strike). Since we paid $3.87 per share for this spread, we can make $10 minus $3.87, or $6.13 per share. Each contract, therefore, is a maximum profit of $613 in this particular example ($6.13 per share multiplied by 100 shares per contract). Had we paid only $2.50 for this spread, we could have made $10 – $2.50, or $7.50 per share.

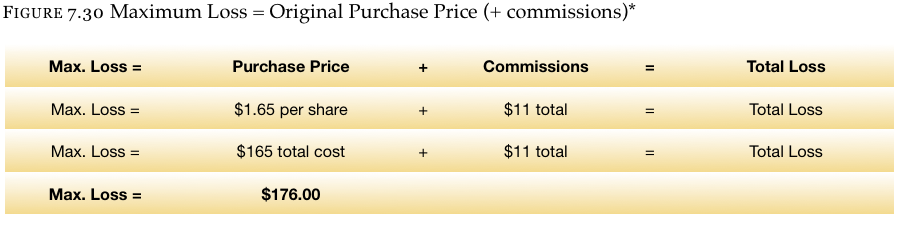
Maximum Loss
And like most things in life, the most you can lose on it is what was spent. When you spent $3.87 per share on the spread, the most that could be lost is the original $3.87 investment even if the stock went to zero. If you had bought a car for $38,700 and drove it into the lake, never to be seen again, and you never bothered getting insurance on the vehicle, then you would have lost $38,700.
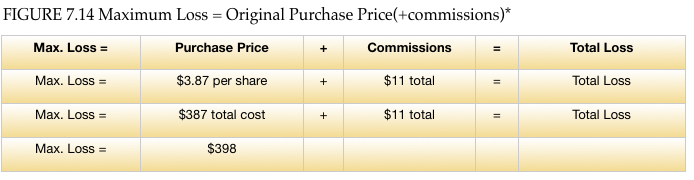
* Don’t get confused here when you see “-” and “+” around the commissions. You will always be paying commissions on your trades. Brokers do not have a charitable side to them. The negative and positive signs are there to show where the broker will take the commissions cost. For illustrative purposes, we will simply state that the cost of commissions to buy and/or sell this spread is $11. Different brokerage firms have different commission schedules and rates.
The maximum profit has a negative sign associated with it because the commissions will be taken away from your profit.
The maximum loss has a positive sign associated with it because the cost of commissions will be added to the loss.
And just as you bought the call spread, someone else had to have sold it. When one person makes money, the other loses an equal amount. If the buyer is making $2 per share, the seller has to be losing an equal amount. Likewise, if the stock were to go down, the seller would be making money while the buyer loses money.
In the example above, we saw that the stock had started at $201 per share, but had to rise 1.43% to $203.87 for the spread to even break-even. This was more favorable (under most circumstances) to being long a naked call, but the stock had to run higher to break-even nonetheless. Seller’s Benefits
The buyer of a stock, a call, or a call spread can only make money if the stock appreciates upwards, but the seller of the call spread has 3 ways to make money:
- Market Stays Unchanged
If the market closes at the same place it started at the beginning of the month (in our case, with a stock price of $201), the 200 – 210 call spread will expire worth only $1. The buyer will lose $2.87 of his $3.87 investment, but the seller gets to keep the entire sale price of $3.87 minus the $1 of intrinsic value he has to give back. Thus, the seller of the spread will be allowed to keep $2.87 per share ($287 per contract) with the stock at $201.
- Market Declines
The best thing that can happen to the buyer of the call spread is for the stock to run higher immediately after purchasing the spread. The reverse is then true for the seller of the spread who is hoping that the stock declines immediately after the spread is sold. So long as the stock closes below the lowest strike price, neither call will have intrinsic value at expiration and the spread will expire worthless or is worthless.
If the spread is worth nothing on expiration it can be bought or sold there. Thus, if you sold the spread at $3.87 and it is worthless, it is the equivalent to getting the spread for free and selling it at $3.87 – but in reverse. A $3.87 profit per share will be realized.
- Market Advances Slightly Even
If the stock advances a small amount, the seller of the vertical spread can still make money provided the stock does not move beyond the break-even point which is calculated as follows:
Vertical Break-even = Closest to ATM strike + Spread Price
Because the closest to at-the-money strike is 200 and the cost of the spread if $3.87, the break-even is $203.87 ($200 + $3.97). So long as the stock is below $203.87 at expiration, all of the premiums collected will be kept.
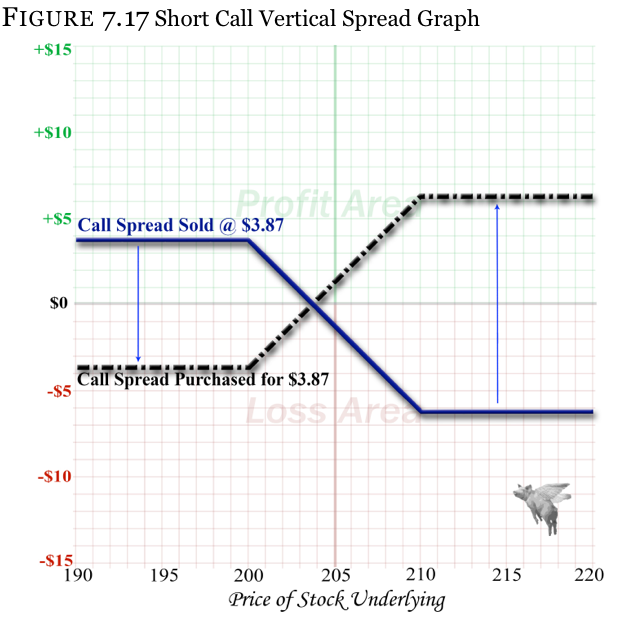
Short Call Vertical Spread Graph
Perhaps the best way to visualize how the sale of a call vertical spread works is by looking at a profit and loss graph, and then comparing it to the purchase of a call spread. The following graph shows the long call spread and short call spread on top of one another. The faded dashed line represents the spread purchased for $3.87 that we previously saw. Meanwhile the dark line is that of its seller.
Notice how the two lines are mirror images of one another. Whatever the seller of the spread makes, the buyer of the spread will lose, and vice versa.
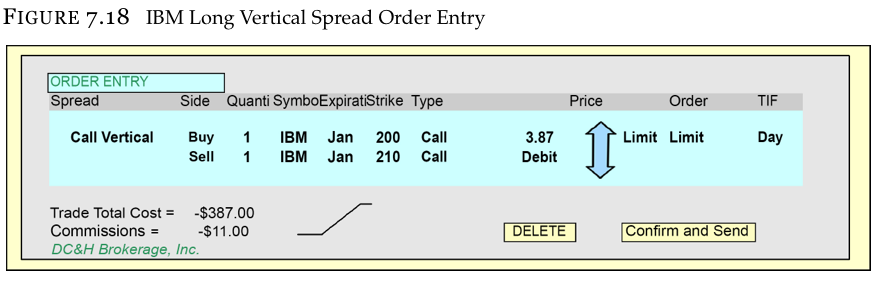
Like all of the strategies we have shown so far, entering a vertical spread is no more complicated on most broker trading platforms. Below you will notice that the call vertical we have been discussing has been entered into the trading platform and is ready to send to the trading floor for execution. Please take further notice of the price of the spread being a $3.87 debit.(Figure 7.18) This debit price is all that is entered.
Entry Price (Long Call Vertical Spread)
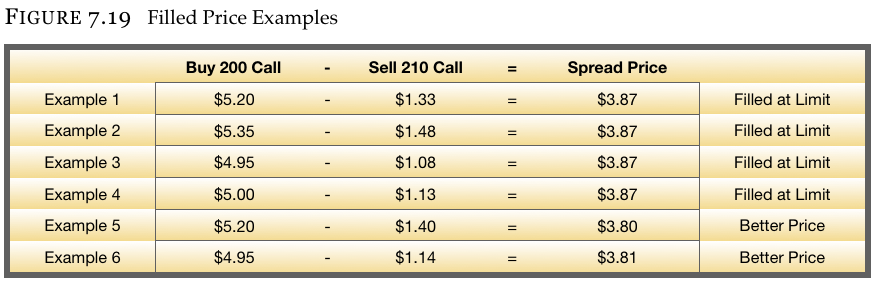
We were analyzing the vertical spread when the 200 strike call was trading at $5.20 and the 210 strike call was trading at $1.33 to give us a net debit of $3.87 per share ($5.20 – $1.33 = $3.87). Since the markets are changing every moment of the day, it is not necessary to be filled at those exact prices. As a matter of fact, you are rarely filled at the same exact prices the options were trading for when you looked at the spread initially. Our only concern is that the trade is not filled at a price higher than $3.87, and if the broker can buy the spread at a lower price he/she will. The $3.87 is simply a limit price that you have instructed your broker that you are not willing to pay anything more for.
Depending on if the stock advanced or decline at the time you placed the order, and depending on where the broker chose to fill the order(s) in the middle of the bid and ask spread, you could see any one of the fill prices in Figure 7.19.
Request Video of Option Basic Seminar ? Click here
Up to this point we have solely been concerning ourselves with call verticals. We are not trying to diminish the role that put spread plays in the investment world; rather we purposely avoided skipping around so we didn’t add to the confusion. You will find in your further studies that the call spread and put spread are intricately linked to one another and can be used in conjunction with one another to create hedging and arbitrage opportunities.
You probably have gathered by this point that if a call spread can enhance your chances of success over a naked long call, then the put spread will likely enhance your chances of success over a naked long put. And the great thing about put spreads is that they work the same way as call spreads with the exception of you having a bearish opinion instead of a bullish one (This means that you think the market will decline rather than increase).
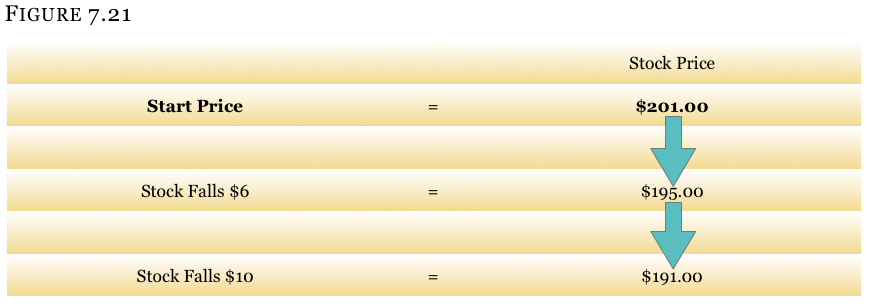
So instead of believing that the stock is advancing, let’s examine what a put spread looks like when we have an inkling that the stock (bond, commodity, ETC, etc.) is going to decline in value. For consistency we will go back to the same option chain we have been working with to date.
It doesn’t matter how much you think the stock can go down. That will be different for every stock and the conditions in the overall market at the time. This will be addressed in the criteria portion of this chapter momentarily.
- Stock falls $6 to $10
Making the assumption that a fall of $6 is probable and a fall of as much as $10 is possible, we have a couple of choices to make with regard to the put spread.
Knowing the possible outcomes for this stock, a choice of spreads will be created from which you can choose what best suits your tastes.
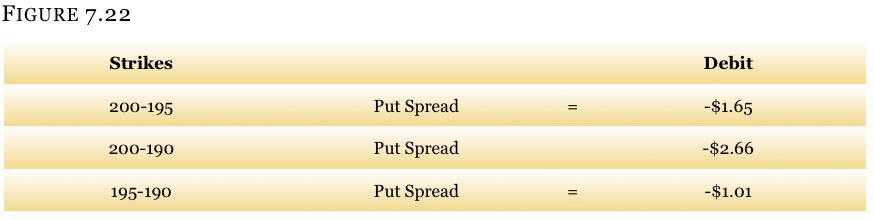
- Choice A 200-195 Put Vertical Spread
Because we know that the stock is starting at $201 and likely going down from there, we can start with buying the ATM 200 strike. The obvious choice would be to sell the 195 put against it, thus turning this into a $5 wide spread. Since we feel that the stock can get down to $195 with a good degree of certainty, selling the 195 put against the 200 strike puts purchased is a logical decision.
- Choice B 200-190 Put Vertical Spread
We can also look at buying the same 200 strike put, but selling a further out-of-the-money (OTM) put to take advantage of a possible drop of more than $6. We already learned that the maximum that can be made on the spread is contingent on how far OTM we sell the put (or call in call verticals). Thus, when we sell the 195 put, the stock dropping further below $195 does not provide us with any more of a profit. Yet, if we move the strike being sold from 195 down to 190, we will have on a $10 wide spread (200 – 190), albeit at a higher investment cost.
- Choice C 195-190 Put Vertical Spread
By now you may have noticed that the spread is cheaper to purchase as it goes further OTM. You might have even said to yourself, “Why buy a $5 ATM spread like the 200 – 195 for a $1.65 debit when I can move everything down 1 strike to the 195-190 strike spread which will only cost me a $1.01 debit?”
Depending on many variables (the amount that the stock can move, support levels, if the stock is in a bear or bull market, etc.), it may be a good idea to buy a cheaper and further out-of-the-money spread provided the stock has a reasonable chance of falling enough to make the spread worthwhile. This will be addressed in the criteria section of the material. In the meantime, let’s assume that we will only evaluate the 3 spreads mentioned so far:
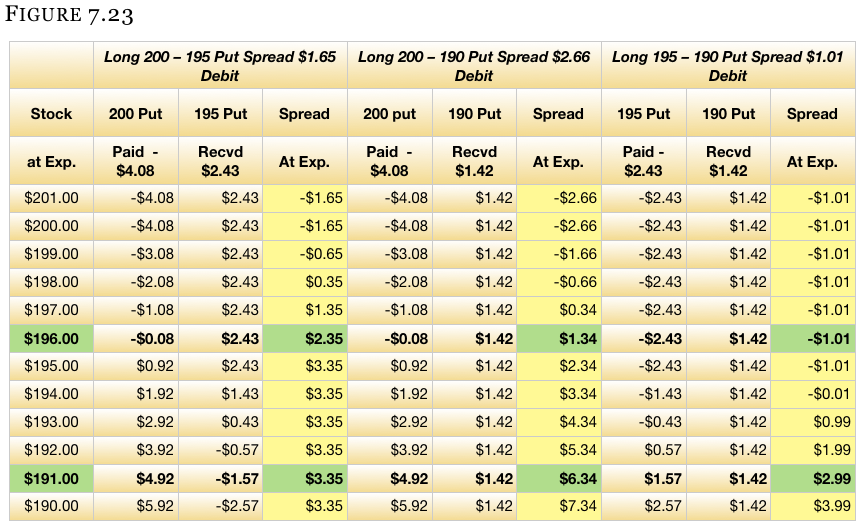
The math for evaluation is set up in Figure 7.23.. The highlighted columns are the 3 spreads’ net profit or loss at expiration. The bold text highlights the stock prices we predicted of $195 and $191. Looking at Figure 7.23 will assist you in determining which spread best meets your objectives and opinions.
Other Terms
Like any other industry, jargon is created out of nowhere and for no apparent reason. Instead of keeping things simple, someone says something and it grows roots. The table below is a list of other names for vertical spreads. Do not feel obligated to learn all the terms or think that memorizing them is required for successful trading. The broker’s website you use will likely describe them as “vertical”. The list below is written in order of frequency and correctness; the most correct terms are first.
Comparison Among Choice A, B and C
Which of the three spreads is the best? This is the difficult thing about trading, and you really only know the correct answer at expiration. Yet you do not have the luxury of a crystal ball to look into the future, so a decision has to be made.
For some, a graph of the profit and loss of the long put spreads will make the decision easier. Next is the graph of all three vertical spreads so you can compare them. When viewing the graph, keep the three stock prices in mind:
1. Stock Starting Price of $201 – What if the stock closes unchanged in a month?
2. Stock Down $6 – What is the profit at $195 compared to what it would be if the market moves in the wrong direction?
3. Stock Down $10 – What do the different strategies make at $191 compared to if the stock moved in the wrong direction? Keep in mind that there is a much higher probability of the stock moving down $6 than $11
Fungibility
Don’t fret about how to close the trade when the time comes. Options are fungible, meaning you do NOT have to sell the spread back to the original trader. When you buy a stock and sell it out later, you do not seek out the same guy you did the original trade with to see if he will trade again. You bought from one individual, sold to another individual, and the stock got taken out of your account. The same thing occurs with a spread.
Just like with call spreads or naked options, anyone wanting to buy a put spread needs it sold to them. Someone will be on the other side of the trade. You think that the stock is going down, but meanwhile someone on the other side of the trade is thinking that the market is going to stay steady or run higher.
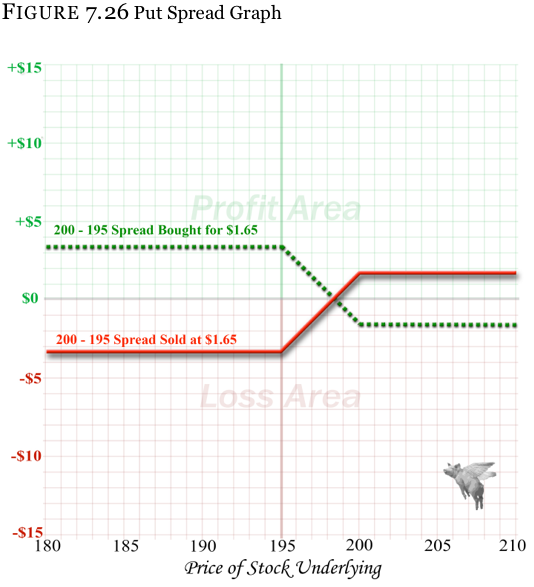
So, just as with the call spread example where we compared the purchase and sale on the same graph, we can do the same with a put spread to show how they too are mirror images of one another. We will compare the purchase of the 200 strike – 195 strike put spread for a $1.65 debit to its sale. Remember, that, when someone buys the put spread, they are hoping the market goes down and pays the premium. The seller hopes the market advances and he receives the premium.
Table
Some people will want to see a mathematical comparison throughout a range in the stock between a long spread and a short spread side-by-side. Figure 7.27 table shows how the buyer and seller of the same put spread we discussed above will actually share an equal and opposite profit and loss risk profile.
When looking at the table, you will notice a horizontal and vertical highlighted area. The horizontal area that has been highlighted shows the area between the strikes of the spreads. The vertical area has been highlighted shows the net PNL columns of the two spreads. This will make the profit or loss of the long spread easier to compare with the profit and loss of the short (sold) spread.
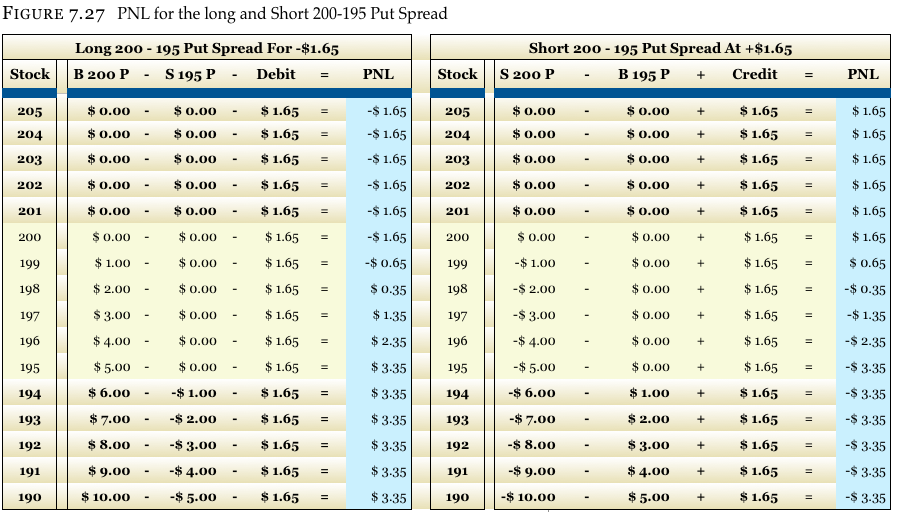
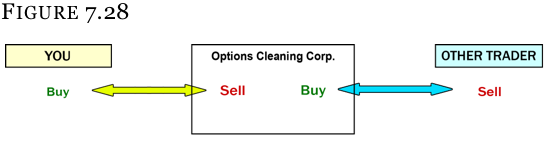
OCC
Figure 7.27 often helps people realize that, no matter what happens, your loss is offset by someone else’s profit and vice versa. At this point many people start to question, “Okay, say I have a huge winner but the other guy who lost money to me can’t afford to pay. How do I get my money?” This is not only a great question, but a practical one as well.
All option transactions go through something called the Options Clearing Corporation, or OCC. Their website is www.optionsclearing.com.
They are the guarantee of every option transaction, and some of the people responsible for setting margin requirements so that you are assured to collect what is coming to you (or pay what you owe). They literally take the other side of every transaction so that your trade will never have a problem. And even during the crash of 1987 and the banking crisis of 2007-2008, they were never even close to being insolvent. They have earned their AAA rating by being sound stewards of the marketplace and do not do any investing on their own.
So even if the person who did the trade with you cannot afford to pay you, the OCC will pay you immediately. You will not even know anything has changed. Then the OCC will be the ones to attempt to collect the monies from the other party. They, in theory, are standing between you and the other trader on every transaction.
To determine the break-even point on a put vertical, you calculate it the same way as the call, but instead of adding the cost of the spread, you will subtract it. This is done because we need the market to move lower (not higher like with the call spread) to gain intrinsic value.
Put Vertical Break-even = Closest to ATM strike – Spread Price
Using the put spread above we can calculate the break-even very easily. We use the 200 strike since it is the closest to ATM strike in the 200 – 195 put spread. Then, we simply subtract the cost of this spread, which is $1.65, from $200 to get a break-even of $198.35.
Anything below $198.35 is a profit to the buyer and a loss to the seller. The seller begins to make a profit at any stock price above $198.35.
We already saw that the break-even points were calculated slightly differently from the call vertical spread, BUT the maximum profit and maximum loss are calculated exactly the same way. An example follows Figure 7.29.
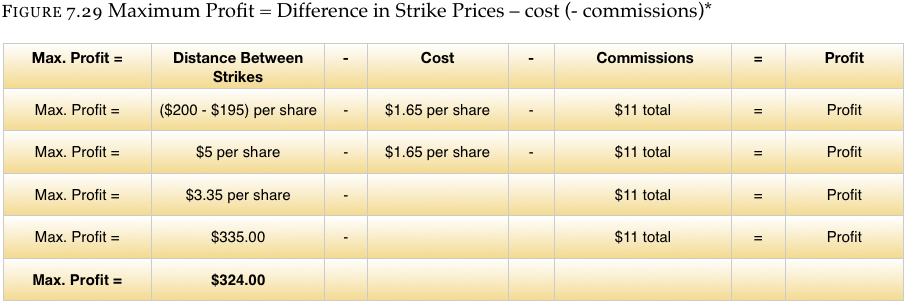
* Don’t get confused here when you see “-” and “+” around the commissions. You will always be paying commissions on your trades. Brokers do not have a charitable side to them. We added negative and positive signs to symbolize how commissions work.
When you receive the maximum profit, commissions will be taken out, thus it has a negative sign associated with it.
When you experience the maximum loss, commissions will be added to the loss, thus it has a positive sign associated with it.
For illustrative purposes, we will simply state that the cost of commissions to buy and/or sell this spread is $11. Different brokerage firms have different commission schedules and rates.
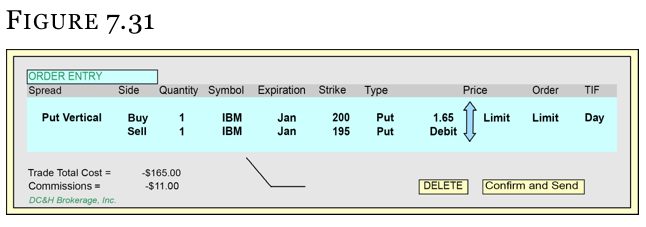
Order Example (Long Put Vertical Spread)
In Figure7.31, you will notice that the put vertical we have been discussing has been entered into the trading platform and is ready to send to the trading floor for execution. Please take further notice that the price of the spread is a $1.65 debit. This debit price is all that is entered – not the two individual options making up the spread.
Sometimes your trades will be lucky and only hindsight will tell you with certainty which ended up as the better trade – buying or selling the vertical. But after reading the criteria portion, you may decide that you want to learn towards selling a vertical spread instead of buying a vertical spread because of variables like high volatility levels.
We have found from a very informal survey of our colleagues both on and off the trading floor that many do NOT buy or sell vertical spreads for a directional bet. Rather, they use vertical spreads as the building blocks for more sophisticated trading strategies such as Broken-Wing Butterflies, Butterflies, Condor, Iron Condors, Boxes, Jelly Rolls, etc. Mastering vertical spreads will make learning every other option strategy much easier. Ignoring vertical spreads will make learning complicated strategies almost impossible.
Both buying and selling vertical spreads can be a profitable so we will provide a helpful refresher on the market opinions for each spread. Remember that there is buying a vertical call spread (bullish) and selling a vertical call spread (bearish). There is also buying a vertical put spread (bearish) and selling a vertical put spread (bullish).
![]()
Thus if we feel that the market is going to go higher, we can buy a bullish spread (long call spread) or sell a bearish spread (short put spread). The same holds true in reverse.
Both the long call and long put spread are most often used to take a directional bet. In other words, you believe that the stock is going to move in a particular direction and you want to place a trade with a good risk-to-reward ratio. Spending $3.87 on a spread that can be worth a maximum of $10 in the future sounds like a good bet to many.
If you think that the market might move in one direction, stay still, or even calm down from its current place, then you could employ a sale of a vertical spread. We touched on this previously, but another example will make this last statement more understandable.
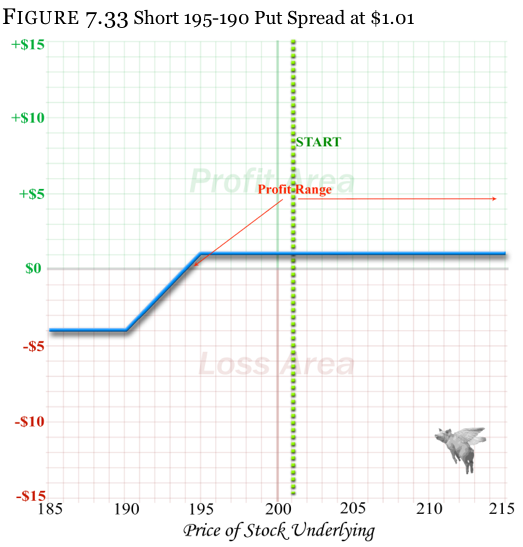
With the stock at $201,we can make the argument that we feel the market is calming down. We are bullish on the market, but not enough to believe that the stock is going to run all the way up to $210 where we need it to go in order to make the maximum profit on a long call spread trade. Solution? Sell a put spread.
If you sell the 195-190 put spread at $1.01 per share ($2.43 195 put / $1.42 190 put), you are hoping the market closes above $195 and the buyer is hoping it closes below it. So with the stock starting at $201, we need the stock to stay where it is, go up, or not sell off too much. This is a huge advantage compared to the person who needs the stock to sell off below $190 to make the maximum profit.
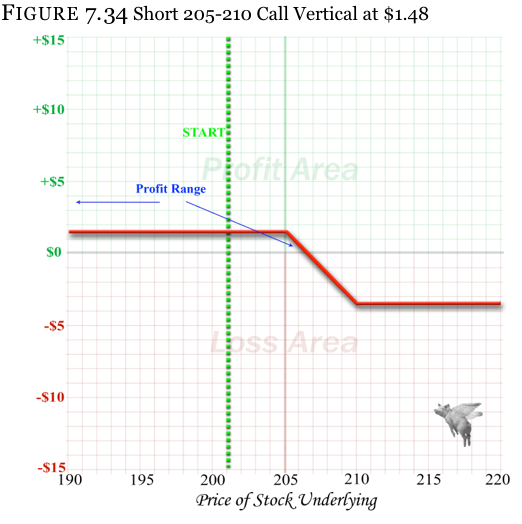
The same thing can be done with a short call spread for people who are slightly more bearish than bullish. Instead of selling the 195-190 put spread, we could sell an out-of-the-money call spread like the 205-210 short vertical at $1.48 ($2.81 and $1.33). In this instance, you would want the stock to go down (anywhere), stay flat, or just not go up above $205 (from $201 starting price). The graph for that trade would look as Figure7.34.
Further Study
After seeing both of these short vertical spreads, you might ask, “What if I think the market is going to stagnate? Can I sell both (call and put) verticals?” The answer is a resounding yes. This is what we were referring to when we stated that vertical spreads are the building blocks of more complicated trades that most market-makers prefer. The simultaneous sale of a call and a put spread is called an “iron condor” and is covered in the at-home study course, Essentials. This and the many other trades preferred by professional traders are obviously beyond the scope of a basic introductory course.
What about the short call or put being taken away?
First we have to learn two terms, and how they are defined.
Exercise – An early exercise is when the OWNER of the option elects to convert his LONG option into shares of stock prior to expiration.
Assignment – An assignment is when the SELLER of the option is forced to lose his SHORT option position and have shares (either long or short) put into his account.
When first learning option strategies, such as collars, time spreads, and vertical spreads, the new option trader will often get overly concerned about selling one option against another long option. Once the concept that buying an option gives the owner the right (but the not the obligation) to convert the option into physical shares, the other side of the coin becomes visible.
You start to realize that you are long and short an option in these various spread positions. You are comfortable with being long an option because nothing will happen unless you make the conscious decision to contact the broker and make it happen. In other words, you will not wake up one day and see actual shares of stock in the account unless you want them there.
But selling an option is a little trickier since the other person has control. When you sell an option you have no control over when the other person may want to exercise his right to buy (call) or sell (put) stock shares. You can then wake up one morning and find out that the owner of the option you sold has converted his option into stock and you now have a stock position even if it was protected.
If you sold a call, you will then have to sell shares of stock. Because the owner of the call has the right to buy stock, you have the obligation to sell stock.
If you sold a put, you will have the obligation to buy shares of stock. The owner of the put has the right to sell stock at any time, which mandates that you buy shares.
The put exercise is not nearly as large of a worry as the call exercise with stock options. The reason is not important right now and is the subject of more complicated texts (Option Professional available at RandomWalkTrading.com), but we will give you a quick answer. Most stocks pay a dividend, thus prior to a dividend being paid, the owner of the call will exercise the call to turn it into stock so that he can receive the dividend. No one is going to want to exercise a put and sell a share, thus being forced to pay the dividend. This is an oversimplified answer, but one that should suffice for your introduction to options.
What if you are assigned?
When first learning vertical spreads, many neophytes have the uneducated fear that they do not have control over the option they sell. They know that, when they buy an option, they can exercise it (or not) any time they choose. But if this is true for the option they buy, the opposite must be true for the option they sell and it is.
This is NOT a concern with most strategies that Random Walk teaches as we only instruct in risk averse positions, concepts, and strategies. With the positions we are teaching, like this vertical spread, you are always going to be protected.
As a matter of fact, when buying a vertical spread you will learn to absolutely love an assignment notice from your broker. The case study of a call spread will illustrate your first glimpse of assignment, what happens, and how you will actually end up with a free synthetic option.
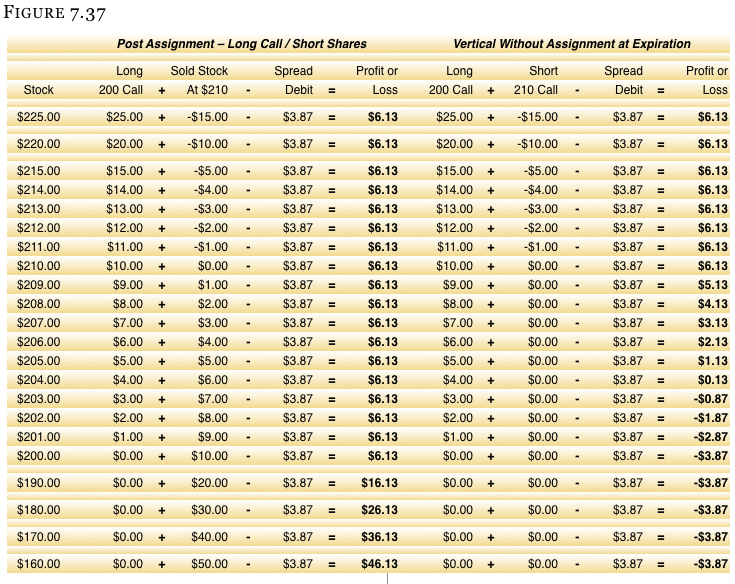
Using the call spread as an example, we can illustrate what would happen after an assignment.
You sold the 210 strike call as part of the spread, which the buyer will not ever want to exercise until the stock runs above $210 (the strike price). There is no reason to exercise a call at the 210 strike and end up with long stock from $210 when the stock is trading at $207. It would be cheaper to simply buy the stock at $207 rather than buy it at $210 through exercising the call.
Thus the stock must be trading at a minimum of $210 per share. Also keep in mind that you are long the 200 strike call which will have an intrinsic value of $10 when the stock is at $210.
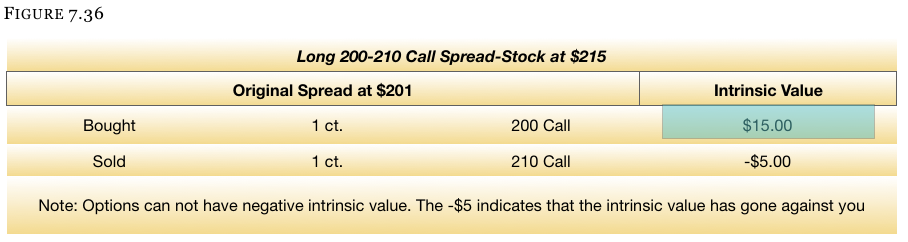
So let’s say the stock runs to $215 per share (from the starting price of $201). The calls will have intrinsic value as Figure7.36, plus some time value (not shown):
Timing
Exercises and Assignments can ONLY take place at the close of trading for the day. After the stock market closes at 3:00pm central time (4:00pm eastern time), people who want to exercise an option will notify their brokerage house of their intent. Well before the market opens the next morning, you will be notified of an exercise or assignment being completed and see an appropriate stock position in your account.
With our current spread, we would be assigned on the 210 strike call. Since a call gives the owner the right to purchase shares at the strike price, being the seller of the call will require you to sell short shares of stock at $210. The first time people see this in their account, they often panic. They see that they sold 100 shares (per contract) at $210 but the stock is $5 higher at $215. Again, don’t worry because you are long the 200 call that is still making money.
Yes, you will have lost $5 on the stock you sold at $210 when the stock is at $215, but you will be up at least $15 on the 200 strike calls you bought. A $15 profit and a (-$5) loss nets out to be $10. You have made $10 on the call spread, which is the maximum that can be made on a spread which is $10 wide.
Table of Long Call Vertical Spread PNL with/without Assignment
Figure 7.37 perfectly illustrates why there is never a need to worry about being assigned on an option when you are long a spread. The left side of the chart shows that, if you are assigned, you can NOT lose money no matter what happens to the stock between the assignment and expiration. The right side is the PNL of the spread that does not have an early exercise occurring prior to expiration so you can compare.
Free Synthetic Option
As a matter of fact, you will see on this call spread that our original desire was for the stock to increase in price (from $201 to above $210). Then once the assignment occurs, we made the maximum profit prior to expiration day, which you usually have to wait until expiration to receive the maximum profit. Then after the assignment, our opinion will change based on the resulting position. You will see that more money is made as the stock falls lower.
This is now acting almost like a long naked put position. As a matter of fact, it is acting exactly like a long naked put position, and the long call and short stock (by definition) is a synthetic long put. You have made the most you can from the original call spread and were given the profits PLUS a free long put. So when you first get an assignment notice, please avoid your instinct to panic and instead be happy that you were given a great opportunity.
[/ezcol_3quarter_end]