
You have likely already traded options without even knowing it, so learning stock and index options will be absorbed faster than you think. If you have ever used a coupon in the store or auto/home insurance, then you have already used options.
And the great news is that there are only two types of options to learn – calls and puts. Call options give you the right to buy a stock, and put options give you the right to sell a stock. Stated slightly different, call options are like a coupon for a grocery store, while put options are like auto or home insurance. By the time you are done with this material, all will make perfect sense and the mystery surrounding stock options will vanish.
We will begin with a call option being like a coupon. From there we will learn how a put option is just like an insurance policy. After that things will make even more sense because we will go into detail about the pieces of the option contracts that we will initially have to glaze over.
Request Video of Option Basic Seminar ? Click here
Suppose that a stock is trading for $192 and you thought it was set to go higher. Instead of buying shares you could purchase a call which gives you the right to buy shares. If you buy the 195-strike call, it gives you the right to buy the stock for $195 any time you want prior to the option’s expiration. Should the stock run up to $200, $210, or $250, you can still buy it for $195.
Suppose that you thought the same $192 stock was going down in price because bad news was coming out. You could purchase a put option that gives you the right to sell shares. If you buy the 190-strike put, it gives you the right to sell the stock at $190 any time you want prior to the option’s expiration. Even if the stock drops down to or below $100 per share you will still be able to sell it at the 190 strike (the agreed upon price).
Now let’s go into what this means in more detail starting with the call, and then proceeding to the put.
Whether you are an avid extreme coupon user or not, chances are high that you have used them at least once in your life. If so, this analogy will allow you to understand a call option with little or no difficulty.
What is a grocery store coupon?
It is a legally binding contract the store provides that allows you to buy something at a discounted price. The coupon, like a stock option, has several features:
- An agreed upon price/discount = strike price.
- Quantity
- An expiration date
Computer Coupon

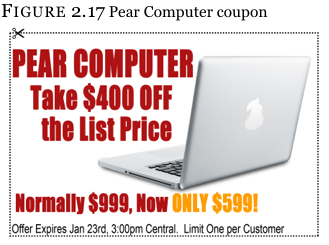
The coupon entitles the holder to buy a new PEAR 3000 laptop for $599, regardless of the store’s list price. Even if the computer is selling for $999 to the general public, the coupon allows the holder to get the laptop for $400 less. That coupon has a real value of $400 to anyone wanting to buy the computer. And being a coupon, there is always that fine print lawyers come up with that includes an expiration date, and how many you can buy.
A stock coupon, known as a “call” option, works the exact same way as our PEAR coupon. A little story will assist in making this comparison.
Suppose that you had a strong inkling or belief that a certain stock called XYZ or PEAR (PEAR Computer, Inc.) was going to go up dramatically after earnings come out in the next 2 months. Every time you go to the shopping mall, most of the stores are dead with almost no customers. Yet, whenever you walk past the XYZ and PEAR stores, you notice that they are so full of shoppers that you can’t even get into the store, and most people leave the two stores with shopping bags in their hands.
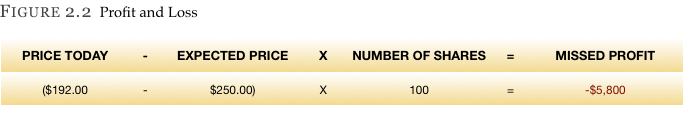
Being a little more intuitive than the average shopper, you are not upset by the long lines you have to stand in to make a purchase. Rather you are wishing you were the owner of the store. And since the company is publicly traded, buying shares in PEAR does make you a partial owner of the store. Yet, the price of PEAR is $192 per share and you do not have enough money to buy 100 shares of stock (total cost of $19,200 = $192 per share X 100 shares) until you receive your Christmas bonus in 2 months. What do you do?
You are afraid that by the time you have the cash to purchase PEAR shares, the stock price could be at $250 per share. If that happened not only would you have missed the opportunity to make $58 per share ($250 – $192), but now the same 100 shares will cost you $5,800 more. Not having money is such an inconvenience, huh? Well, there is a solution.
Instead of buying 100 shares, you can buy the right to purchase 100 shares – the call option. The coupon we were previously talking about gave you the right to buy 1 computer for $599, regardless of how much the store was charging, any time you wanted before the expiration date. The call option will allow the same thing, but for shares of stock instead of a computer.
We can buy the right (a call option) to buy the stock for $195 per share any time we want in the next two months. Buying this call option will cost us $1.35 per share.
So what does all that mean?
You may be thinking, “Why would I pay money for the right to buy the stock at a higher price than it is trading for right now? After all, right now I can buy the stock for $192 per share, but this coupon gives me to the right to buy the stock $3 higher at $195 – that is no savings.”
The thing you have to keep in mind is that you cannot afford to buy the stock right now, and you are expecting it to trade for $250 a share by the time you can afford the stock. Yet, the coupon will still be valid by the time you get your bonus. When you do get your bonus, you can still buy the stock at $195 per share, even if the rest of the world has to pay $250 per share.
The really powerful thing about this option is NOT only that it saved you $55 ($250 current price – $195 where you can buy it), but that if the stock falls, you are under NO obligation to buy the stock. If your opinion on the stock is wrong and the stock falls to $150, there is no reason you would exercise your option and buy the stock for $195. You simply throw out the call option just like you would throw out your coupon when walking into the computer store and noticing that the computers are marked down to $499 (recall your computer coupon allowed you to buy the machine for $599). Computer prices drop fast, and sometimes stocks do as well.
Request Video of Option Basic Seminar ? Click here
Put options work the same way as the call but in reverse.
When you buy a car and insure it, the insurance is to protect you from a loss should you get in an accident or the car is stolen. Let’s say that you purchased a new car for $30,000 and bought complete and total coverage on the car that guarantees 100% reimbursement. Good luck finding that policy as most policies have legal fine print, but let’s assume for this example that it is true. We will also say that that policy costs $1,000 per year.
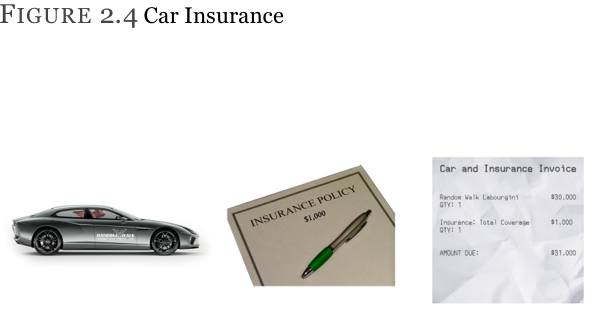
Three months later your awesome Random Walk Spider 600 series car is stolen. How much are you out? The first thought is that you are out nothing because you have such great insurance, and they are going to write you a check for $30,000. Yes, the insurance company is obligated to pay and will write you a check for $30,000 (the cost of the car), but they are going to keep the $1,000 premium you paid on the policy.
This is just like a put option.
Car Insurance
The insurance policy allows you to sell the car to the insurance company at $30,000 any time you want within the lifespan of the policy (usually 1 year).
Stock Insurance
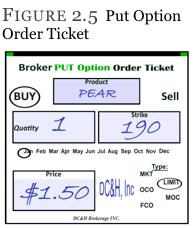
A put allows you to sell the stock to the put seller at the strike price any time you want within the lifespan of the option.
The put order Figure2.5 demonstrates the right to sell 100 shares of PEAR at $190 per share (the strike price) any time you want prior to expiration. Instead of costing $1,000 (like the car insurance) this insurance policy will cost $1.50 per share ($150 total as $1.50 per share X 100 shares = $150).
So what does this call option really mean? What will it provide and cost?
To help investors understand all that is needed to make an educated decision about an option trade by providing continuity, the exchanges standardized options. When looking at the PEAR option below, we can assume many things about this trade and all options. We will go through them quickly and then expand on each one later.
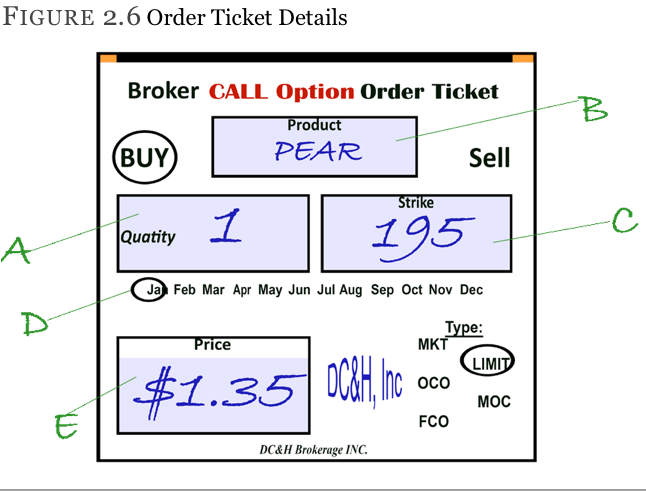
A – This option gives the owner the right (but not the obligation) to buy 100 shares of stock.
Every option contract (and in this case it is a quantity of “1”) controls 100 shares of stock. If you want to control 80, 90, or 135 shares of stock, you are out of luck. The exchanges standardized each option contract to control exactly 100 shares of stock to keep things uniform.
So 1 contract controls 100 shares, 2 contracts control 200 shares, 3 contracts control 300 shares, and 12 contracts control 1,200 shares.
B – This option contract is for shares in PEAR Computer (not a real company – yet!).
Not all stocks have options listed on them, but if there is enough interest from the public in a certain stock, they will usually begin listing options for it.
C – This particular PEAR option gives the owner the right to buy the stock for $195 a share. This is also known as the “strike price” or “exercise price”.
Just as the exchanges standardized the number of shares that determine each option contract (100 shares per contract), they also standardized what strikes a certain stock will have. Though there is a likelihood that someone may want to buy the stock at $190.13, it would be ridiculous to list options at every single possible stock price.
Liquidity is defined as a particular asset’s (stock, bond, option, commodity, etc.) ability to be bought or sold without significantly moving its price. Every trader should ensure that stocks and options can be traded without delay when they are trying to find a willing buyer and seller. When fewer strike prices are available, interest will decline at each strike price. On the other hand, if there were only 1 strike price that could be traded, people would not have enough choices when trying to do various option strategies. The exchange, therefore, tries to come up with a reasonable balance of strike prices for each stock on which they list options.
Each exchange has a committee whose responsibility is to come up with that balance for each stock with listed options. They do have a set of guidelines that they work with but are allowed do deviate on a case-by-case basis. Next is a list of the guidelines that the exchanges work from, but there will be exceptions to every rule. Do not be upset or discouraged by trying to memorize which strikes the stock(s) you are interested in are listed. Any decent broker’s website will simply default for the available strikes when you put in a stock’s name. All listed options, regardless if they follow the standardization procedure or not, will come up when the “option chain” (all the options traded) loads.
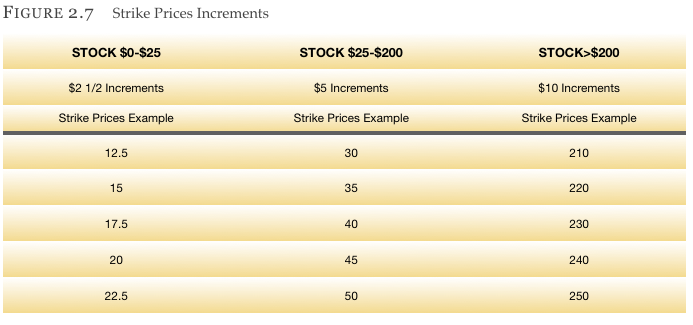
Typically
- stocks trading under $25 have strike increments of $2½
- stocks between $25 and $200 have strike increments of $5
- stocks trading over $200 have strike increments of $10
D – The expiration month in this option is for the month of January.
Options do not expire at the end of the month as one would expect, rather they expire on the third Friday of the month. But you might ask, “What if Friday is a holiday?” In that case, the options would expire the day before, which would be a Thursday.
Also, some websites say that “expiration is the Saturday following the third Friday of the month.” This is not totally accurate. Saturday is the day the options are settled into stock or cash (index options). There is no trading on Saturday so the third Friday is technically the correct date of expiration.
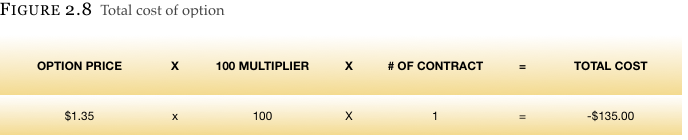
E – The price of this PEAR call is $1.35 per share.
You will remember that each option contract controls 100 shares of stock. Since options are quoted on a per-share basis, you will have to multiply this option’s $1.35 cost by 100 to get the real, or total cost of this option.
The total cost of this option will be $135.
Expiration Months
Don’t worry if the next section seems confusing. Most floor traders don’t know this material, except in the few stocks that they specialize in.
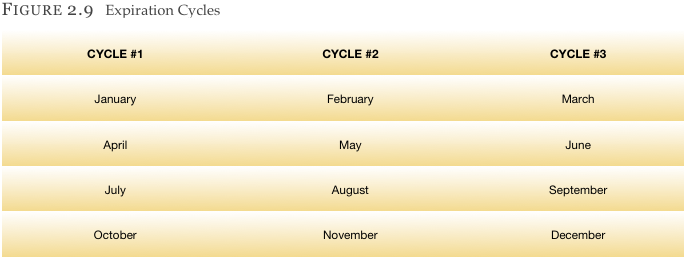
Stock options are all divided into one of three different quarterly cycles. This is done to provide some predictability as to which option months will be added the next time. The addition of new months will occur after an expiration of one month, so a new month is added to replace the month going away. The Exchanges like to have at least four months trading at the minimum for any given stock (equity) option.
The exchange will ensure that there are ample short term and medium-long term options available for trading. Let’s take the stock Microsoft Corporation (stock symbol: MSFT) as an example.
Microsoft is a cycle #1 stock, meaning that it will definitely have options in January, April, July and October. How do we know? To be honest, despite the fact that we are floor traders, we still had to look it up. You don’t need to memorize this. We just want to provide an explanation in case you wonder why two different stocks have different expiration months available.
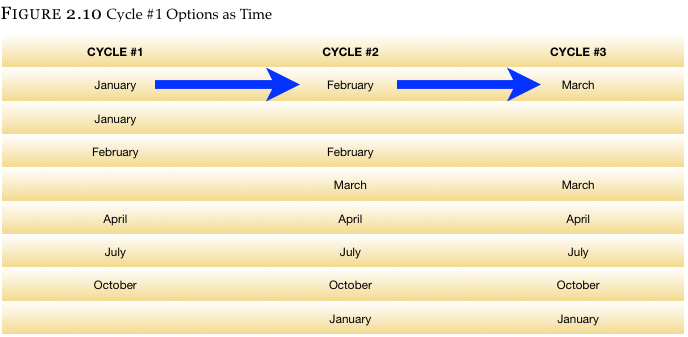
Microsoft will also have options in the two front months for liquidity purposes, so depending what month it is right now, there will be options in months other than what is designated. Let’s walk through an example where we start looking in the first week of January in MSFT.
We know that it will certainly have January, April, July, and October options to start. From there we also know that it will have a second month of February options added for liquidity as most people prefer to trade in the front two months. Once the January options expire, the stock will need two more front month options, so March will be added to the already existing February options.
This next section may seem a tad confusing, but don’t worry. Any decent broker’s site will have all the available months already listed for you.
Trading Hours
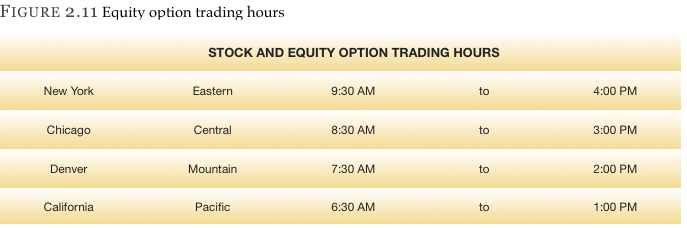
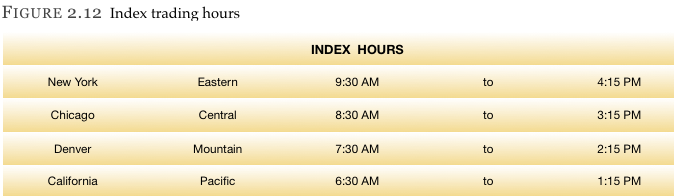 Trading on expiration day continues up to the normal close at 4:00pm eastern time. There is an exception to this – index options trade 15 minutes longer, until 4:15pm.
Note: There are some strange expiration specifications for a few indexes, so always check to make sure you understand how each index expires and settles before investing. Further reading on indexes will be seen later in this text.
Multiplier
Because most options control 100 shares per contract the term “multiplier” is often used instead of saying “times 100 shares per contract” every time we talk about options. This will come in handy later when we discuss index options that expire into cash instead of shares – but we are getting ahead of ourselves. For now just keep in mind that the term “multiplier” is synonymous with “number of shares per contract”.
Here are a few more examples to help you understand:
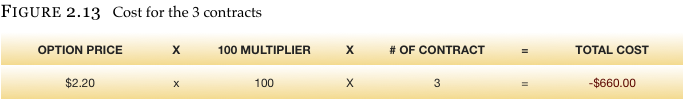
* Buying 3 contracts (300 shares of stock equivalent) of a $2.20 call (or put) will cost $660.
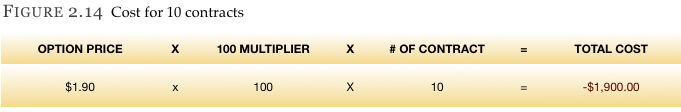
* Buying 10 contracts (1,000 shares of stock equivalent) of a $1.90 put (or call) will cost $1,900.
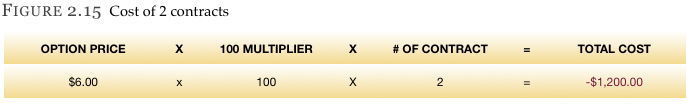
* Buying 2 contracts (200 shares of stock equivalent) of a $6 call (or put) will cost you $1,200.
* Selling 7 contracts (700 shares of stock equivalent) of a $2.95 call will bring in $2,065.
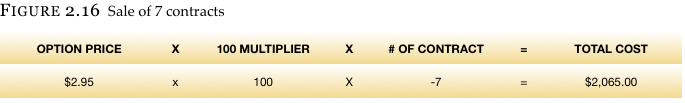
Notice that we bring in money when we sell a call. We will talk more about this shortly, but it is exactly like any other transaction. When a buyer purchases something, he pays money to the individual who is selling the product. Instead of a car, home, or boat, an option is being sold in this example.
People new to options have many questions, and one of the first is probably why options are priced differently.
In the examples we just reviewed in this chapter, the option prices ranged from $1.35 to $6. How do we determine a fair price? This is an excellent question and will be answered now.
The two components of an option’s price are intrinsic value (IV) and time value (TV). Whatever is not intrinsic value is time value. This will make sense in a moment when we go over the two individually.
“Intrinsic Value” is an option’s real value. It is also the portion of the option price when there is no consideration for time.
When determining the intrinsic value of an option, many people think, “What would this option be worth if it were the exact moment of expiration Friday?”
Those who say “options do not have any real value” are uneducated as to what an option truly is. Let’s go back to our PEAR computer coupon. The computers retail for $999. But with the coupon in hand, we can purchase the machine for $599. This is a real savings of $400 – four hundred dollars.
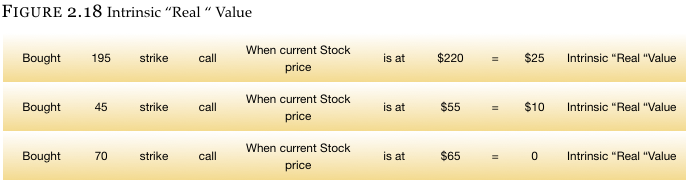
The same phenomenon is at work with options. Suppose that you own the 195-strike call. This gives you the right to buy the stock at $195 per share any time you want prior to the option expiring. You bought it because (as discussed earlier) you felt the stock could make a giant leap up in price, and you didn’t want to miss out on that advance even though you could not afford to own the shares.
If your assumption is correct and the stock advances to $220 (which is not the full $250 you were expecting but still an advance), you will most likely still have a fair sized profit. You know that your option will have real value because you have the right to own stock at $195 and people who do not have the option have to buy shares in the market place for $220 – this is $25 more than you can buy it.
By owning this call, you made $25 per share minus the $1.35 it cost you, or $23.65 per share. With the option of controlling 100 shares of stock, you made $2,365 ($23.65 per share X 100 shares). This is real value. Without the option, you would have to pay $220 per share if you wanted to purchase the stock.
Examples:
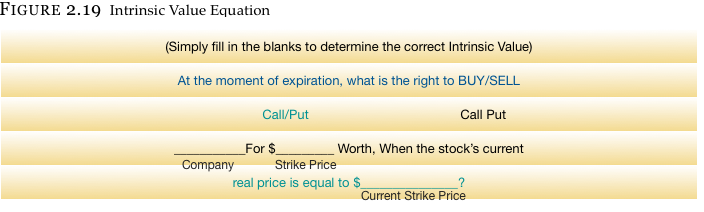
For some people, the easiest way to determine an option’s intrinsic value is to plug the variables into an equation. More than one trader at Random Walk mentioned how they did this process in their head when first learning options. Their thinking process is in Figure 2.19:
We can use a call option and plug it into the previous equation, and you will notice just how easy things are when you follow the math. Suppose we are looking at the 195 call in PEAR and assume that the stock is now trading for $214. What is the intrinsic value of the call?
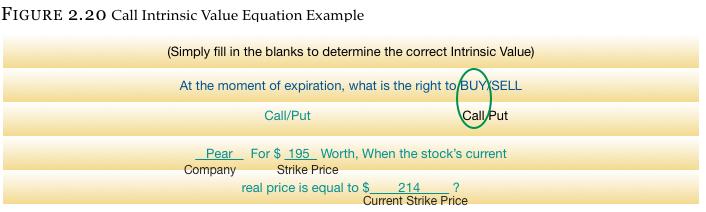
This call obviously gives us a $19 advantage over people who don’t own it, so the answer is $19.
Plugging a put into the equation works the same as the call. We previously looked at the 190 strike put in PEAR that cost $1.50 per share to purchase. If the stock moves to $177, finding out the intrinsic value should be easy.
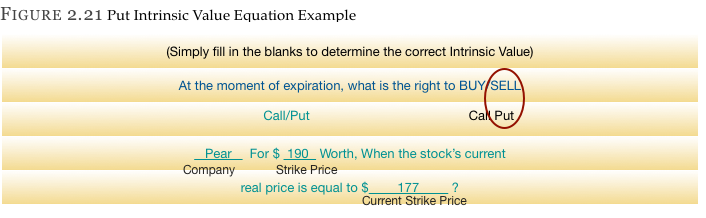
This is put obviously gives us a $13 advantage over people who don’t own the protective put, so the answer is $13.
We saw how a call option with a strike price lower than the stock price had real value. This “intrinsic value” does not have to exist for the option to still be worth something. At first, this may go against common sense, but an explanation should clarify it.
Keep in mind that an option cannot have a negative intrinsic value. It has real value or it does not have real value – but it CANNOT have a negative intrinsic value. When we bought the 195 strike call in PEAR, it didn’t have any intrinsic (real) value. The stock was trading for $192, and we bought an option for $1.35. This has to move up $3 to get to the $195 strike. For it to have intrinsic value, it needs to move more than $3 higher. Yet it was trading for $1.35 because you were buying time.
Time value is defined as the portion of the option’s price that is not intrinsic value. In other words, it is the portion of the option price where you pay for opportunity and time.
When you bought the automotive insurance for your ultra-sleek Random Walk Spider 600 series car, you bought a $30,000 policy to protect a $30,000 car. The insurance policy has no real value. No one calls up their insurance agent after buying a car and tells him to take the car off their hands. They usually wait until they hit a tree or the car is stolen and the car is not worth anything. Yet, the policy cost you $1,000. Why does the policy cost money if it has no real value at the time? When you send a check to your agent, you buy one year of protection. You are buying time. The same theory works with options.
We know that the PEAR 195-strike call is worth nothing from an intrinsic value point of view because no one would exercise their right to buy the stock for $195 when the stock is at $192. $192 is a better value. Yet the $195 call will cost the buyer $1.35 for the opportunity to buy the stock at $195 per share should the stock run up in price.
We already demonstrated how time value was defined as the portion of the option’s price that is not intrinsic value, so determining the time value of an option is straightforward. You only need to take the price of an option and subtract its intrinsic value (if any) – what remains is time value.
We saw earlier that the 190 strike put in PEAR was trading for $1.50 per share ($150 per contract as each contract controls 100 shares). When the stock is at $192, we would obviously be able to receive $192 if we chose to sell the stock. If we elected to sell the stock by exercising the put option (which gives us the right to sell the put at $190 any time), you would only be able to sell the shares at $190. We would not want to use the put, which means it has no real intrinsic value. Yet the put costs $1.50.
Like the insurance policy on the car, the stock insurance policy costs $1.50 (per share) for the protection it provides between the time it is purchased and the time it expires. The car insurance would pay off if you got into a car accident, and the cost of the put would pay off if the stock market fell. If you do not get into a car accident, the insurance policy will expire worthless, and if the stock does not decline, so will the put option
The terms intrinsic value and time value are a little too formal for most people, so traders came up with another term for the same thing(s). Do not be intimidated by yet another set of new vocabulary terms – these are not too difficult.
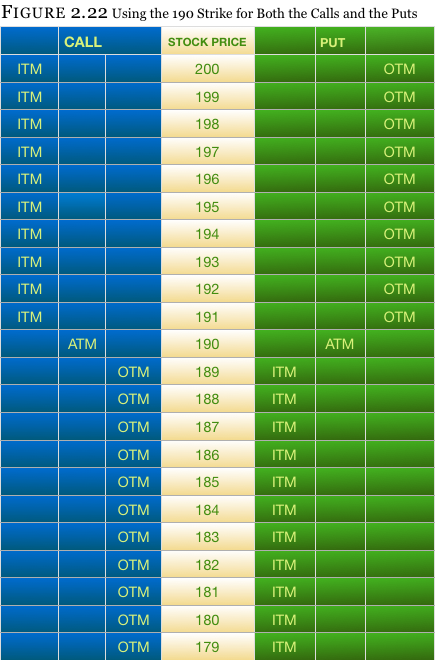
In-the-money (ITM) and out-of-the-money (OTM) are terms used to designate whether the option you are looking at has real/intrinsic value. If the option has intrinsic value it is referred to as being “in-the-money”, or ITM. Those options that do not have real value are called “out-of-the-money”, or OTM.
You will also hear of the term “at-the-money” or ATM. This refers to the strike price that is closest to the current stock price. With PEAR trading at $192, you are looking at a choice between the 190 and the 195 strike. The strike that is closer to $192 (the stock price) is the 190-strike. We would refer to this as the “at-the-money strike”.
For some, the race horsing analogy will be beneficial. You may have heard someone say, “My horse came in-the-money,” meaning that they made money on the ticket they purchased – be it win, place or show. Options work the same way. If you have an option that is ITM, it has intrinsic value.
If you are still confused about the concept, simply go back to the original intrinsic value equation. There is another way to think about this:
The terms intrinsic value and time value are a little too formal for most people, so traders came up with another term for the same thing(s). Do not be intimidated by yet another set of new vocabulary terms – these are not too difficult.
In-the-money (ITM) and out-of-the-money (OTM) are terms used to designate whether the option you are looking at has real/intrinsic value. If the option has intrinsic value it is referred to as being “in-the-money”, or ITM. Those options that do not have real value are called “out-of-the-money”, or OTM.
You will also hear of the term “at-the-money” or ATM. This refers to the strike price that is closest to the current stock price. With PEAR trading at $192, you are looking at a choice between the 190 and the 195 strike. The strike that is closer to $192 (the stock price) is the 190-strike. We would refer to this as the “at-the-money strike”.
For some, the race horsing analogy will be beneficial. You may have heard someone say, “My horse came in-the-money,” meaning that they made money on the ticket they purchased – be it win, place or show. Options work the same way. If you have an option that is ITM, it has intrinsic value.
If you are still confused about the concept, simply go back to the original intrinsic value equation. There is another way to think about this:
- Calls have intrinsic value when the strike is lower than the stock.
- Puts have intrinsic value when the stock is lower than the strike.
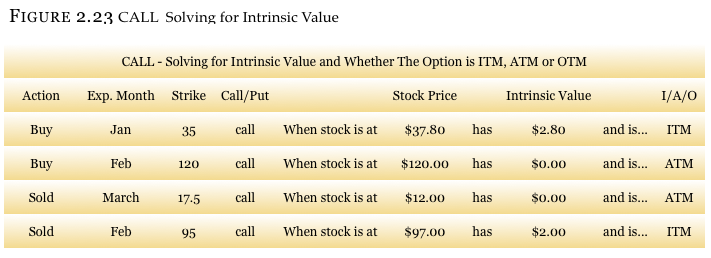
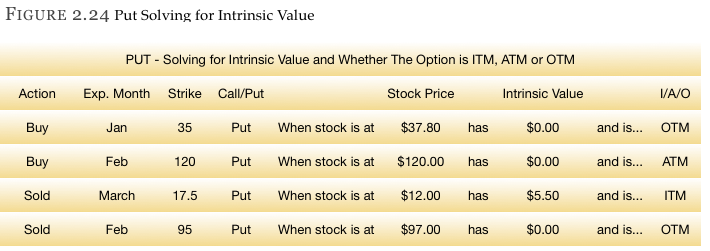
The next example will illustrate how to find out if the option is in or out-of-the-money, and will also show the amount of intrinsic value in the option. Look over this material for a few minutes and it will sink in. The first set will be with calls and the second set will be with puts.
Request Video of Option Basic Seminar ? Click here
Volatility is usually defined as the amount a stock (or commodity, index, etc.) moves in a given period of time. The time period can vary depending on the individual’s desired measurement, but let’s use one year as the initial example.
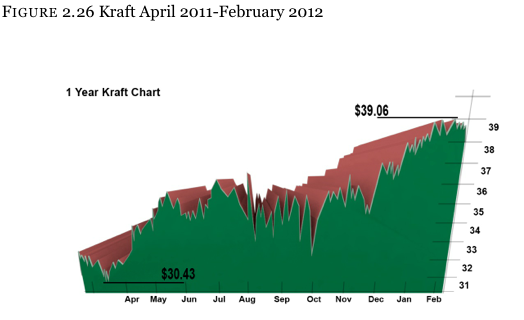
The best way to explain volatility is through the comparison of two different stocks both trading at the same price. Comparing Kraft foods (KFT trading at $32.20) and Adams Resources (AE trading at $32.28) both trading within $0.08 of each, you would think that the stocks would have something in common. Yet, when you look closely at the performance of the stocks for the past year, you will notice that they trade in dramatically different ways.
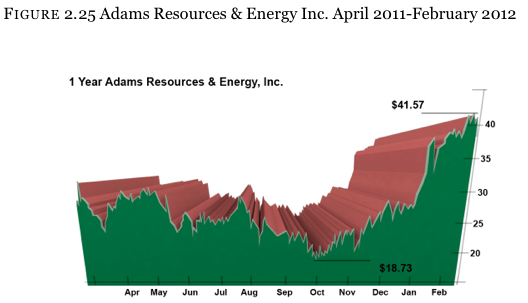 Kraft foods traded in an $8.63 range (high = $39.06, low = $30.43) while Adams Resources traded in a $22.84 range (hi = $41.57, low = $18.73). In other words, Adams Resources moved in a range of close to three times (2.65) as large as Kraft. This indicates that Adams Resources has been much more volatile for the last year.
Some people have a better understanding of how these two stocks compare to one another when the two stocks overlap on the same chart. The next chart shows Kraft as a solid line and Adams as a jagged line (known as an “open, high, low, close chart”). It is more obvious from this chart that Adams is roughly three times as volatile as KFT
You just saw how two different stocks trading at the same price can move in totally different ways, just like how two kids from the same parents can have totally different personalities. This is why option prices are what they are.
Think about the story of the Three Little Pigs from when we were children. There was a house made out of brick, one made from wood, and the last made from straw. Upon hearing news of a wolf in the neighborhood, they called their insurance company. Which home do you think cost the most to insure? Which the least?
Obviously the cost of insurance for the brick house was the least expensive and the straw house was the most expensive. Why? The straw one has the highest probability of burning or blowing down, which would cost the insurance company money to replace. The same idea is at work with options on stocks.
We know that Kraft stock (1 year range of $8.63) is very stable when compared to Adams Resources (1 year range of $22.84). Because stocks have the same probability of moving down as up (this will be discussed later), both the upside calls and the downside puts should be more expensive for Adams than Kraft. Imagine that the stock market is in a large bull market (in other words, the stock market as a whole is going up dramatically.) This will help us think in more simplified terms to get a tangible feel as to how options are priced.
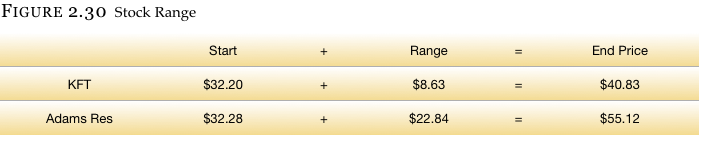
Let’s assume that both stocks will move the same amount this year as they did last year, but because of the bull market, they will only move higher (instead of up and down). We know that this is not how things happen in the real world, but it will make this example easier to understand. We also know that both stocks are starting at about the same price of $32.20, but will run higher by the same amount as last year’s normal range (Kraft = +$8.63, AE = +$22.84).
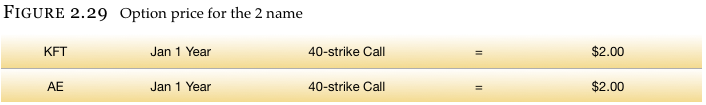
Now suppose that you had the following one-year-until-expiration options from which to choose. Which would you prefer to purchase knowing that they both cost $2, have one year of time to make money, and allow the owner to buy the stock at $40 any time?
If you have not figure out the answer yet, perhaps the pieces will start fitting together as we continue. Recall that the 40 strike call allows the owner to buy the stock at $40 at any time. So when would you want to buy the stock for $40? Only if you could sell it at a higher price, like $45 per share.
Looking at Figure 2.30 reveals our answer. Going off the assumption that each stock will move higher by the amount it moved last year, we see that Kraft will end the year at $40.83 while Adams will end the year at $55.12. Since both options allow us to purchase the stock at $40 per share, and since they cost the same amount, we would prefer the Adams calls over those of Kraft.
There will always be some naysayers who say, “But I know Kraft. I buy all their products. I have never heard of Adams. I would rather own the Kraft calls.” That is fine. You can go out and buy the Kraft calls, but you will not make money. And just what will our profits for each of the calls be one year later?
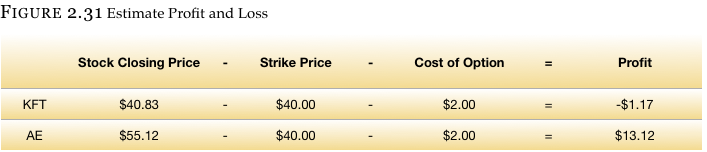
Here you will notice that the Kraft option actually lost money. The stock went from $32.20 up to $40, but money was lost because the stock did not climb high enough for the call to make back the initial $2 investment. This does happen and can be very frustrating. You bought an instrument that was supposed to make money when the market went up, then the market went up, but you lost money. Please do not get discouraged yet; the two scenarios listed below will hopefully get you interested once again.
- Sell the call – If buying the call did not work out even though the stock went up, why not sell the call and take in the $2 (instead of paying it out)? What if the stock didn’t move for one year or went down in price? Then we should make money, right? Yes, and we will get to that shortly.
- Options trade at different prices – Many people reading this may think about what just happened and say that it is obvious that they want to own the call in Adams and not Kraft. Since both options were the same price, many people will just buy a call in the stock that moves the most and ignore the stock that doesn’t move.
Afterwards, the Las Vegas thinkers will begin to realize that the Adams call is worth a lot more than the Kraft option, so it should be trading higher. As a matter of fact, they will state that the Kraft call is too expensive and the Adams call is too cheap – and they are right.
Figure 2.32 example illustrates why the same option (strike and time until expiration) in two different names will be trading at different prices even though the cost of the stocks are the same.
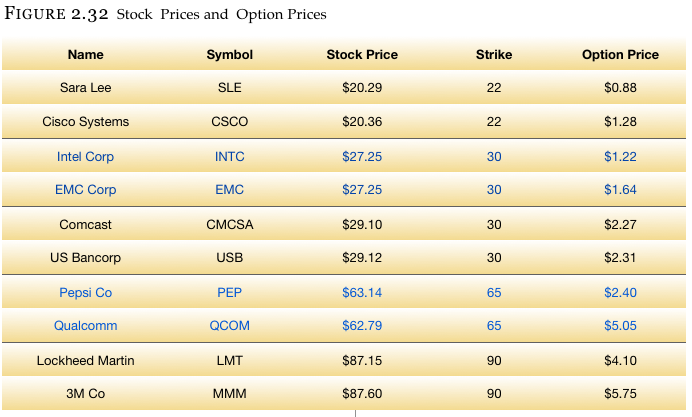
Here are some examples of instances where the stock prices between two companies are almost the same, the time until expiration is the same (331 days), and the strike prices are the same; yet, the price of the options are different. Why? The stocks themselves move on different volatility levels. Remember that a straw home will move more than a brick home in the wind, and that is why the put options (insurance policy) are more expensive.
Relax,
Thus far you should be keeping up, even if only by your fingernails. A little frustration is normal. You are being provided with a lot of new information all at once, but we want to assure you that everyone is capable of grasping this material. It may take a second reading, but it is very realistic to assume you will know this information in no time. As a matter of fact, this is the most difficult part of option trading. Once you grasp these concepts, the rest is much easier. If you are having no problems so far, then congratulations are in order – you may be a natural.