

CHAPTER 1: STOCK
Yet, most people first being introduced to stocks and stock options have very little knowledge of even what a stock is. This brief overview of stocks will provide you with enough working knowledge needed to make learning options easy. If you want more information on stocks, you can go to our website at RandomWalkTrading.com and learn more.
A stock is simply a unit of ownership in a company.
If you were a kid and started a lemonade stand with a friend (his name is “Cheapy” as for reasons understood shortly), you could issue stock to keep things fair. Suppose that the start-up cost of the lemonade stand was $100 for the cost of wood, paint, lemons, water, sugar, ice, etc. You put up $60 and your friend put up $40, and you agreed to split the time working the stand somewhat evenly. If the stand only took in $100 before you got bored of it and shut it down, it would not be fair to divide the proceeds evenly. Thus you decide to issue stock in the venture and call the company John Lemon’s Lemonade.
You and your friend decide to form a quasi-company that issues 100 shares of stock, each costing $1. Because you put in $60 towards the start-up of the company, you will receive 60 shares, and your friend who put in $40 will receive 40 shares. Neither of you mind that you are receiving more shares than your friend, “Cheapy”, because you both know that this is going to be the most profitable lemonade stand in history. Forty, fifty, or sixty percent of $10 million – what’s the difference?
Now as time passes past the first euphoric days in business where you both are envisioning millions, conflicts and differences in opinions may occur. You feel that adding a second, more premium line of pink lemonade, as well as cookies, will increase sales. Yet Cheapy doesn’t want to take a portion of the sales and reinvest it in the company. Cheapy has his eye on the newest series of Pokémon™ cards and feels cookies, even if they will bring in more profits, are a waste.
As you can imagine, disagreements like this could arise, and that is why it was good that Cheapy and you started a company. Like all friendships, partnerships and marriages, the relationship can come to an abrupt end in these tenuous situations. Fortunately companies take a vote on major issues, and it is a majority vote that wins. Each share has 1 vote.
Since you have 60 shares, you have 60 votes on pink lemonade and cookies, and Cheapy has 40 votes against the major expansion plans. Fortunately, you two didn’t open your lemonade stand like neophytes, and started it as a company. Your 60 votes mean that, despite Cheapy’s wishes to speculate on the future value of Pokémon™ cards, you will be investing in a less volatile product – cookies.
From this point on, as profits are made, the division of that money will be paid out on a per share basis. If the company spends $200 in start-up costs, cookies, and more lemonade, and takes in $500 in sales, the profit is $300. At this point, the company could be liquidated because winter is coming, or the two of you could elect to just pay out the $300 in profit to the shareholders (you and Cheapy).
Supposing that you want to continue running the business but pay out the $300 in profits, the math is straightforward. What you do is declare a dividend (the payout) to the two shareholders. (Dividends will be covered in more detail shortly.) The math literally consists of just dividing the profits ($300) by the number of shares (100) to come up with a dividend payout of $3 per share ($300 / 100). To figure out what each of you is owed, all you have to do is multiply the number of shares each shareholder has by the dividend amount ($3 per/share).
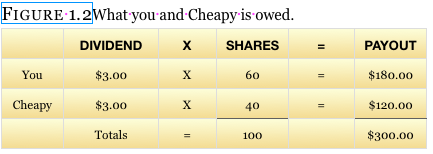
Now if you have friends or business partners like some people have had in the past, the first thing you are going to hear from Cheapy is that he didn’t want to sell pink lemonade, sell cookies, and now is getting ripped off. Of course, Cheapy is going to whine about everything that he brought to the lemonade business and how he is entitled to half ($150) of the $300 profit – not $120. Yet it is totally fair and that is how stock works in corporations. The fact is that you invested more money than Cheapy did (50% more) in the company. Had the two of you been shut down by the health department and had a total loss, you would have been out more money than Cheapy. It all comes down to risk and reward. You put up more risk capital and are entitled to more of the spoils of victory.
The price of a company’s stock is based on the net value of the company (assets minus liabilities) PLUS some amount over or under the net value. There are dozens of statistical formulas to assist in calculating what a stock is worth. For example, the “P/E ratio” is one of the more familiar terms you will hear when talking about stocks. This is simply the price of the stock (say $50) divided by its earnings per share (say $2.90) – or how much the company makes.
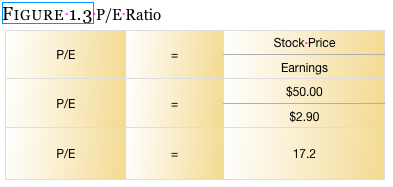
Example: Say a company has a P/E of 17.2. Analysts will then use this number and compare it to other companies in a similar industry to evaluate if the stock is over-priced or under-priced. There are many fundamental flaws and misleading assumptions that can be made when trying to evaluate a company’s real value, and entire business libraries can be filled with texts praising the benefits of stock evaluation. As a matter of fact there are three main schools of thought regarding stock evaluation:
- Technical Analysis
- Fundamental Analysis
- Random Walk Theory
A) Technical Analysis Technical analysis is the study of charts and past price movement of stocks in the attempt to glean a forward looking guidance to future stock movement.
B) Fundamental Analysis Fundamental analysis is the more scientific method of determining future stock prices via the use of ratios and statistics as illustrated in Figure 1.3 ratios.
C) Random Walk Theory Random Walk (RW) theory is the mathematical formalization of successive movements in order to explain stocks, psychology, physics, biology, economics and chemistry. RW theory has also been called “the drunkard’s walk” because the markets move in a random fashion and cannot be predicted. Since Princeton Economist Burton Milkiel wrote the text “A Random Walk Down Wall Street” in 1973, RW theory has been accepted as fact by many economists and large proprietary trading firms. Random Walk Trading believes that evaluating stocks and trying to predict the future is too slow and difficult of a method for making money in the markets (for all but a select elite group of individuals). It is our belief that winning in the stock market can be best accomplished through superior strategies. More extensive material can be found in any library or bookstore if interested in further reading.
A company that has demonstrated consistent increases in profits from one year to the next will have a premium attached to the stock. There is a fairly commonsensical reason for this. If you are going to invest in a company, would you want to invest in one that demonstrates its health and growth, or one that is dying on the vine? Because the number of shares available to be purchased is limited, there will be more of a demand than the supply can handle which forces the price of the stock higher.
Once in a while a company will be in such bad favor with the public that people rush to sell their shares for fear of losing everything if they continue to own the stock. Images of Enron and other bankrupt companies move to the front of their minds, and they panic. Sometimes the selling is so strong and pronounced that the company will trade for less that its “break-up value”, which is what the company is worth if all the assets were sold.
- Buying Stock
- Short Selling Stock
 Money is made on stock as the price of the stock increases if you own the shares. The formula is very simple. All you have to do is multiply the number of shares by the amount of the move, and this will tell you how much you have made (or lost on the stock).
Suppose that your buddy Cheapy is running out of patience for the lemonade business and decides to sell 10 shares of his stock to a friend, Henry. Henry is an entrepreneur in his own right. At the age of 11 he has a paper route and a lawn cutting business that nets him enough money to invest in sound businesses such as lemonade stands. He decides to let his money work for him, instead of working for his money and buys 10 shares of John Lemon’s Lemonade, Inc. for $5 per share. SinceHenry is buying 10 shares, his investment will cost $50 (10 shares X $5 per share).
The following year is one of the hottest and most humid on record. The pink lemonade is a hit, and your new location across from the park is paying off. Sales soar to $900, well above the $500 from the previous year. Suppose that at the end of the year all the shareholders get together to determine the value of the business, and with the advanced business skills picked up in 6th grade, the group determines that John Lemon’s is worth $900 because that is how much you can net in a year. Since there are 100 shares in the company, each share must be worth $9 ($900 company value / 100 shares).
Henry now wants to know what his investment has done, so he does the math. He knows that he bought his shares for $50 from Cheapy, which equated to costing $5 per share. The 10 shares he bought are now worth $9 each. By simply doing the math, Henry determines that he made $40 in one year on his $50 investment. The formula is as Figure1.5:
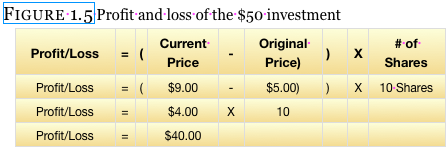
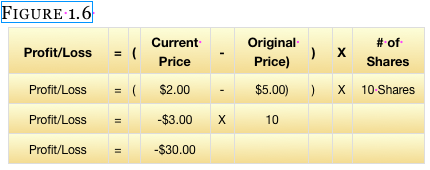
This was not bad at all; Henry got an 80% return on his capital. Yet, things could have turned out the other way for this investment. The price of lemons could have gone up so dramatically as to make lemonade too expensive to make. Cheapy could have blown off doing his shift, leaving the lemonade stand alone. A competing stand could have sprung up across the street and dramatically affected sales. Or it could have been a cold and rainy summer. If sales decreased to $200 and you determined that the value of the company was only worth $200, a loss would have occurred for Henry’s passive investment. Recall that Henry has 10 shares that he purchased for $5 per share. Now after one summer, sales declined to $200 and the 100 shares that the three of you have divided are only worth $2 per share. Henry’s loss would look as figure 1.6.
This may sound like a catastrophe to Henry, and it might just well be. Yet, many people make a good deal of money in the stock market by betting that stocks will go down – not up. How does that work?
Money can also be made on selling stocks that you do not own. This sounds almost illegal, but it is not. It is actually done all the time in business. Dell Computer Company was a master of selling you computers that they did not own. Sounds like a scam, doesn’t it?
Dell
Dell used to have a commercial that implied that they cared so much about their clients that they “were going to build a custom computer to match your needs.” Even though Dell may sound considerate and thoughtful in the advertisements, they were actually keeping their inventory to a minimum. They learned early on that, by the time many computer companies got their products on the shelves, they were already outdated. Michael Dell brilliantly wanted to do something different and take less risk of having an obsolete product going unsold or returned.
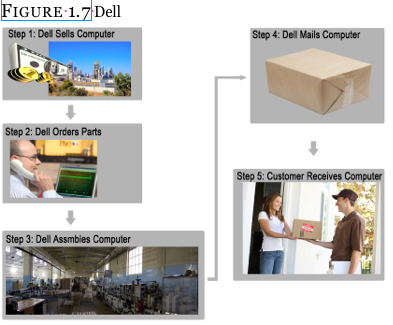
- Dell would get the order from a customer and Sell the computer without even having it in stock.
- Dell would then order the parts.
- Dell would then assemble the computer.
- Dell would send the computer to the customer.
- Customer Receives the Computer. Transaction closed.
Often times in this world, things are sold before they are even created. Ordering a car with custom seats, paint, wheels, etc. often requires you to purchase the vehicle before it is even manufactured. Suppose someone wanted a car with an aquamarine exterior, seats made out of pink dyed elephant skin, and interior carpet and trim that was bright fuchsia mother of pearl.
This color combination is obviously limited to a select few individuals with the most sophisticated sense of aesthetics. Unless Liberace miraculously shows up, this ultimate color palette of a car is unlikely to sell. A better idea would be to sell the car first, and then build it, and deliver it.
The same exact process can be done with stocks.
Often people with little or no knowledge of stocks and/or options have a strong suspicion that a certain stock may decline in price by a large amount. You hear, for example, that there may be an accounting irregularity at a firm called Enron. Despite the superior reputation for excellence, brilliance and ethics that Enron has, you know what devastation even false rumors can have on the price of a stock. Certainly there must be a way to profit from the inevitable decline in the price of the stock before these false rumors are cleared in the next few months and this wonderful stock bounces?
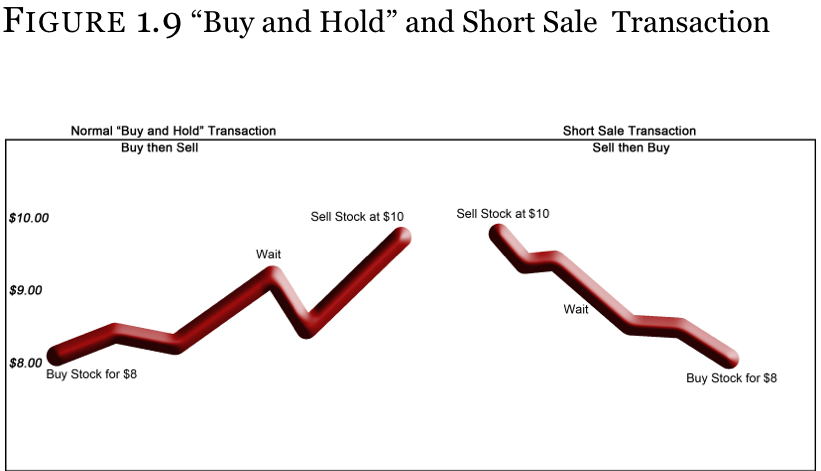
Typically, people buy a stock and then sell it after it goes higher. Here we are going to do the same thing, just in the reverse order. We will sell a stock when it is high and close the transaction when buying it back at a lower price. This is called “short selling”.
As stated, the process works the exact same way that buying a stock to sell at a higher price works, just in reverse. Technically, though you need not concern yourself with the details, you have to “borrow the stock” from someone in order to sell it. Once borrowed, the stock is then sold and you can buy it back anytime you want. At the time you buy back the stock to close the transaction, you then deliver the shares back to the person you borrowed it from and the transaction is closed. The difference between where you sold it and bought it back is the profit (or loss).
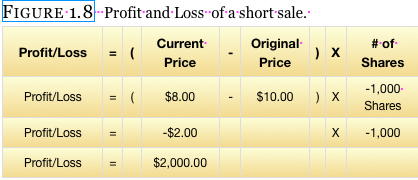
Suppose that you believe that a stock trading for $10 per share is going to drop in price. You go out and sell 1,000 shares (or whatever amount you are comfortable with) at $10 and take in $10,000 in cash ($10 per share X 1,000 shares). A week later the stock does in fact drop to $8 per share! You decide that it is not going any lower and want to take your profit. You go to your broker’s website and buy the stock for $8. This will cost you $8,000 ($8 per share X 1,000 shares) which you get from the $10,000 you took in earlier. The difference from where you sold the shares ($10) and where you bought the shares ($8) is a $2 profit. Multiply the $2 per share profit you made by the 1,000 shares you sold and bought back and you will have a $2,000 profit.
What if you are wrong?
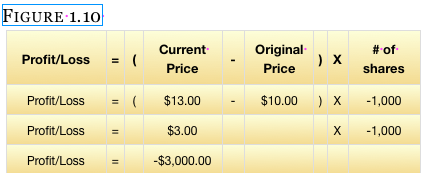
Just like if you bought a stock and it went down, if you sell a stock and it goes up in price, you will lose money. Selling the stock at $10 and watching it go to $8 is fun, but often the stock will not do as you want (which is why you will be learning options as a hedging tool shortly). Suppose the stock went up to $13 instead. In this case you would have lost $3 per share, or -$3000
Dividends are covered here simply because they will affect the price of stock options when the dividend date approaches.
When a company makes money, it has a couple of choices on what to do with it. If the company is growing, the profits are usually reinvested (called retained earnings) in order to create an even larger and more profitable company. If, however, the company’s growth is stagnating and the CEO doesn’t feel that he can reinvest the profits and get a return greater than the current interest rates, he will often issue a dividend.
In the simplest and most common form, a dividend is a cash payout to the shareholders and is calculated on a per share basis. A company that is paying $0.20 per share dividend pays the shareholders $0.20 for every share outstanding. If you own 1,000 shares of stock in the company, you will receive a check for $200 ($0.20 per share X 1,000 shares). It is that simple as far as a shareholder is concerned.
Yet, what does this do to the company paying out all that money?
As you can reasonably suspect, when the company pays out a good amount of its profits back to the shareholders, it dilutes the value of the company. Let’s see what happens to John Lemon’s.
After years of hard work, you, Cheapy and Henry built up the lemonade stand and actually rented a small roadside storefront turning the company into a $2 million business. Because Henry is just a passive investor and is tired of his profits on his initial $50 being reinvested in the company, he wants a payout without liquidating his stock ownership. You all agree to distribute the next 3 months profits in the form of a dividend.
 You and the team come up with a brilliant marketing idea – a free doughnut with every cup of lemonade purchased! And people line up!
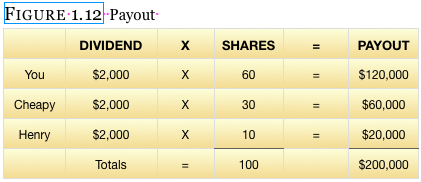
At the end of three months, the company has a profit of $200,000. Since there were originally 100 shares of stock created and you have $200,000 to pay out to the shareholders, a special dividend of $2,000 per share ($200,000 profit / 100 shares) will be allocated. Individual’s payouts look as Figure 1.12:
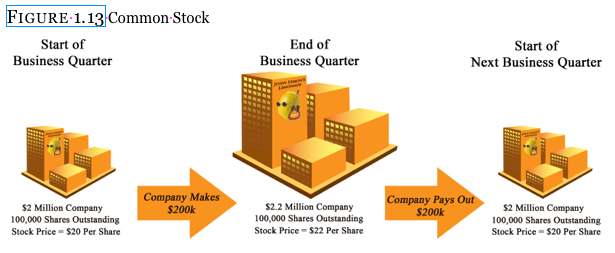
You’ll see John Lemon’s started the quarter worth $2 million dollars, and then made a $200,000 profit after 3 months. Technically the company would be worth $2.2 million now, except that the shareholders agreed on paying out a dividend. This brought the company back down to a $2 million dollar company. The problem with the dividend is that it will be taxed, while the stock shares are not taxed until sold. This is why many people prefer to have high growth stocks that do not pay a dividend rather than low growth stocks that do pay one.
The Figure 1.13 example is the most common form of stock, and is known as “common stock”. There are other forms of stock, such as “preferred shares” that typically don’t have voting rights, yet they do have a claim against company assets should the company go into bankruptcy. Whenever people buy stock they are almost always purchasing “common stock”. You have to go out of your way to invest in preferred shares, so don’t be worried that you are buying the wrong thing.
CHAPTER 2: OPTIONS
You have likely already traded options without even knowing it, so learning stock and index options will be absorbed faster than you think. If you have ever used a coupon in the store or auto/home insurance, then you have already used options.
And the great news is that there are only two types of options to learn – calls and puts. Call options give you the right to buy a stock, and put options give you the right to sell a stock. Stated slightly different, call options are like a coupon for a grocery store, while put options are like auto or home insurance. By the time you are done with this material, all will make perfect sense and the mystery surrounding stock options will vanish.
We will begin with a call option being like a coupon. From there we will learn how a put option is just like an insurance policy. After that things will make even more sense because we will go into detail about the pieces of the option contracts that we will initially have to glaze over.
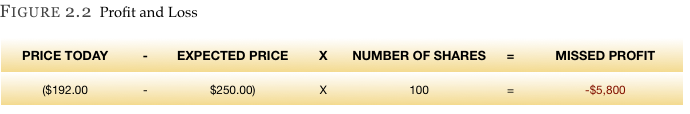
Suppose that a stock is trading for $192 and you thought it was set to go higher. Instead of buying shares you could purchase a call which gives you the right to buy shares. If you buy the 195-strike call, it gives you the right to buy the stock for $195 any time you want prior to the option’s expiration. Should the stock run up to $200, $210, or $250, you can still buy it for $195.
Suppose that you thought the same $192 stock was going down in price because bad news was coming out. You could purchase a put option that gives you the right to sell shares. If you buy the 190-strike put, it gives you the right to sell the stock at $190 any time you want prior to the option’s expiration. Even if the stock drops down to or below $100 per share you will still be able to sell it at the 190 strike (the agreed upon price).
Now let’s go into what this means in more detail starting with the call, and then proceeding to the put.
Whether you are an avid extreme coupon user or not, chances are high that you have used them at least once in your life. If so, this analogy will allow you to understand a call option with little or no difficulty.
What is a grocery store coupon?
It is a legally binding contract the store provides that allows you to buy something at a discounted price. The coupon, like a stock option, has several features:
- An agreed upon price/discount = strike price.
- Quantity
- An expiration date
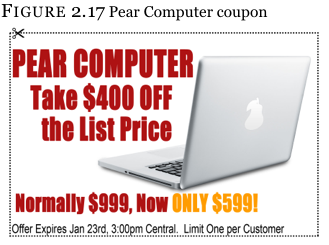
Computer Coupon
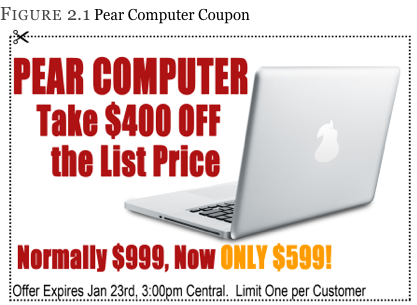
The coupon entitles the holder to buy a new PEAR 3000 laptop for $599, regardless of the store’s list price. Even if the computer is selling for $999 to the general public, the coupon allows the holder to get the laptop for $400 less. That coupon has a real value of $400 to anyone wanting to buy the computer. And being a coupon, there is always that fine print lawyers come up with that includes an expiration date, and how many you can buy.
A stock coupon, known as a “call” option, works the exact same way as our PEAR coupon. A little story will assist in making this comparison.
Suppose that you had a strong inkling or belief that a certain stock called XYZ or PEAR (PEAR Computer, Inc.) was going to go up dramatically after earnings come out in the next 2 months. Every time you go to the shopping mall, most of the stores are dead with almost no customers. Yet, whenever you walk past the XYZ and PEAR stores, you notice that they are so full of shoppers that you can’t even get into the store, and most people leave the two stores with shopping bags in their hands.
Being a little more intuitive than the average shopper, you are not upset by the long lines you have to stand in to make a purchase. Rather you are wishing you were the owner of the store. And since the company is publicly traded, buying shares in PEAR does make you a partial owner of the store. Yet, the price of PEAR is $192 per share and you do not have enough money to buy 100 shares of stock (total cost of $19,200 = $192 per share X 100 shares) until you receive your Christmas bonus in 2 months. What do you do?
You are afraid that by the time you have the cash to purchase PEAR shares, the stock price could be at $250 per share. If that happened not only would you have missed the opportunity to make $58 per share ($250 – $192), but now the same 100 shares will cost you $5,800 more. Not having money is such an inconvenience, huh? Well, there is a solution.
Instead of buying 100 shares, you can buy the right to purchase 100 shares – the call option. The coupon we were previously talking about gave you the right to buy 1 computer for $599, regardless of how much the store was charging, any time you wanted before the expiration date. The call option will allow the same thing, but for shares of stock instead of a computer.
We can buy the right (a call option) to buy the stock for $195 per share any time we want in the next two months. Buying this call option will cost us $1.35 per share.
So what does all that mean?
You may be thinking, “Why would I pay money for the right to buy the stock at a higher price than it is trading for right now? After all, right now I can buy the stock for $192 per share, but this coupon gives me to the right to buy the stock $3 higher at $195 – that is no savings.”
The thing you have to keep in mind is that you cannot afford to buy the stock right now, and you are expecting it to trade for $250 a share by the time you can afford the stock. Yet, the coupon will still be valid by the time you get your bonus. When you do get your bonus, you can still buy the stock at $195 per share, even if the rest of the world has to pay $250 per share.
The really powerful thing about this option is NOT only that it saved you $55 ($250 current price – $195 where you can buy it), but that if the stock falls, you are under NO obligation to buy the stock. If your opinion on the stock is wrong and the stock falls to $150, there is no reason you would exercise your option and buy the stock for $195. You simply throw out the call option just like you would throw out your coupon when walking into the computer store and noticing that the computers are marked down to $499 (recall your computer coupon allowed you to buy the machine for $599). Computer prices drop fast, and sometimes stocks do as well.
Put options work the same way as the call but in reverse.
When you buy a car and insure it, the insurance is to protect you from a loss should you get in an accident or the car is stolen. Let’s say that you purchased a new car for $30,000 and bought complete and total coverage on the car that guarantees 100% reimbursement. Good luck finding that policy as most policies have legal fine print, but let’s assume for this example that it is true. We will also say that that policy costs $1,000 per year.
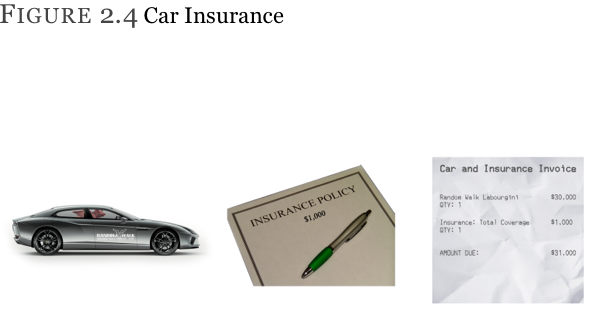
Three months later your awesome Random Walk Spider 600 series car is stolen. How much are you out? The first thought is that you are out nothing because you have such great insurance, and they are going to write you a check for $30,000. Yes, the insurance company is obligated to pay and will write you a check for $30,000 (the cost of the car), but they are going to keep the $1,000 premium you paid on the policy.
This is just like a put option.
Car Insurance
The insurance policy allows you to sell the car to the insurance company at $30,000 any time you want within the lifespan of the policy (usually 1 year).
Stock Insurance
A put allows you to sell the stock to the put seller at the strike price any time you want within the lifespan of the option.
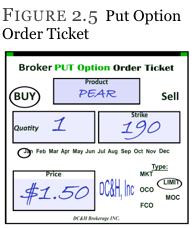
The put order Figure2.5 demonstrates the right to sell 100 shares of PEAR at $190 per share (the strike price) any time you want prior to expiration. Instead of costing $1,000 (like the car insurance) this insurance policy will cost $1.50 per share ($150 total as $1.50 per share X 100 shares = $150).
So what does this call option really mean? What will it provide and cost?
To help investors understand all that is needed to make an educated decision about an option trade by providing continuity, the exchanges standardized options. When looking at the PEAR option below, we can assume many things about this trade and all options. We will go through them quickly and then expand on each one later.
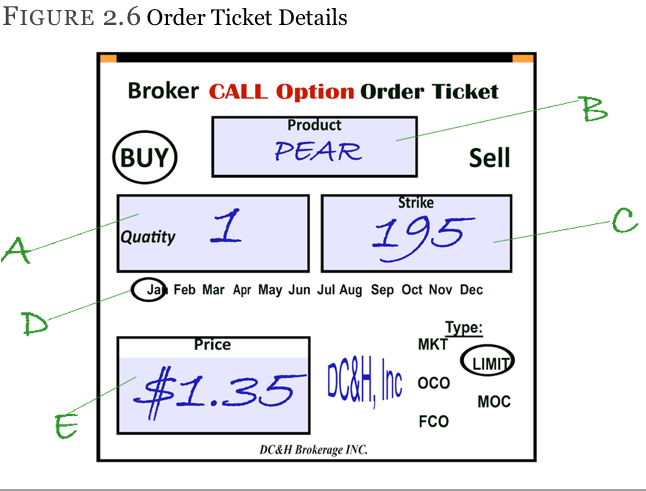
A – This option gives the owner the right (but not the obligation) to buy 100 shares of stock.
Every option contract (and in this case it is a quantity of “1”) controls 100 shares of stock. If you want to control 80, 90, or 135 shares of stock, you are out of luck. The exchanges standardized each option contract to control exactly 100 shares of stock to keep things uniform.
So 1 contract controls 100 shares, 2 contracts control 200 shares, 3 contracts control 300 shares, and 12 contracts control 1,200 shares.
B – This option contract is for shares in PEAR Computer (not a real company – yet!).
Not all stocks have options listed on them, but if there is enough interest from the public in a certain stock, they will usually begin listing options for it.
C – This particular PEAR option gives the owner the right to buy the stock for $195 a share. This is also known as the “strike price” or “exercise price”.
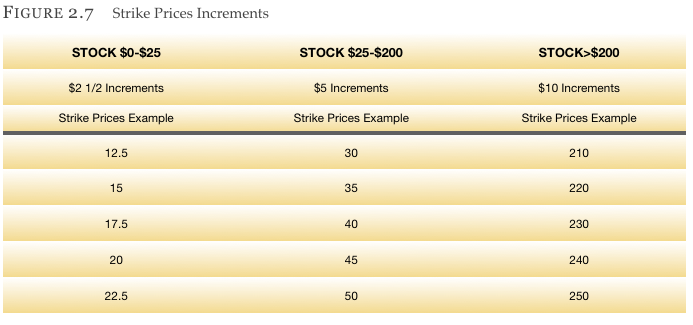
Just as the exchanges standardized the number of shares that determine each option contract (100 shares per contract), they also standardized what strikes a certain stock will have. Though there is a likelihood that someone may want to buy the stock at $190.13, it would be ridiculous to list options at every single possible stock price.
Liquidity is defined as a particular asset’s (stock, bond, option, commodity, etc.) ability to be bought or sold without significantly moving its price. Every trader should ensure that stocks and options can be traded without delay when they are trying to find a willing buyer and seller. When fewer strike prices are available, interest will decline at each strike price. On the other hand, if there were only 1 strike price that could be traded, people would not have enough choices when trying to do various option strategies. The exchange, therefore, tries to come up with a reasonable balance of strike prices for each stock on which they list options.
Each exchange has a committee whose responsibility is to come up with that balance for each stock with listed options. They do have a set of guidelines that they work with but are allowed do deviate on a case-by-case basis. Next is a list of the guidelines that the exchanges work from, but there will be exceptions to every rule. Do not be upset or discouraged by trying to memorize which strikes the stock(s) you are interested in are listed. Any decent broker’s website will simply default for the available strikes when you put in a stock’s name. All listed options, regardless if they follow the standardization procedure or not, will come up when the “option chain” (all the options traded) loads.
Typically
- stocks trading under $25 have strike increments of $2½
- stocks between $25 and $200 have strike increments of $5
- stocks trading over $200 have strike increments of $10
D – The expiration month in this option is for the month of January.
Options do not expire at the end of the month as one would expect, rather they expire on the third Friday of the month. But you might ask, “What if Friday is a holiday?” In that case, the options would expire the day before, which would be a Thursday.
Also, some websites say that “expiration is the Saturday following the third Friday of the month.” This is not totally accurate. Saturday is the day the options are settled into stock or cash (index options). There is no trading on Saturday so the third Friday is technically the correct date of expiration.
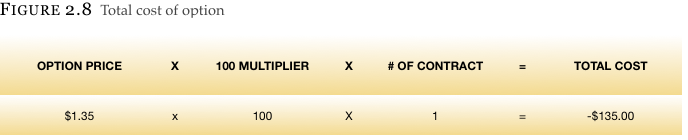
E – The price of this PEAR call is $1.35 per share.
You will remember that each option contract controls 100 shares of stock. Since options are quoted on a per-share basis, you will have to multiply this option’s $1.35 cost by 100 to get the real, or total cost of this option.
The total cost of this option will be $135.
Expiration Months
Don’t worry if the next section seems confusing. Most floor traders don’t know this material, except in the few stocks that they specialize in.
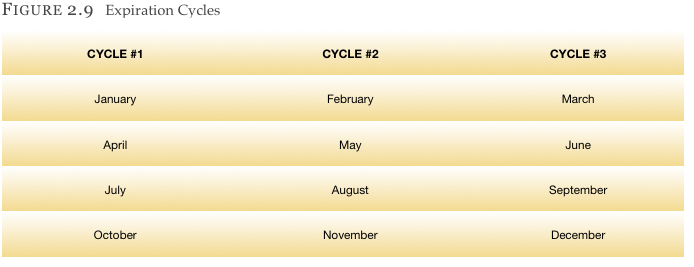
Stock options are all divided into one of three different quarterly cycles. This is done to provide some predictability as to which option months will be added the next time. The addition of new months will occur after an expiration of one month, so a new month is added to replace the month going away. The Exchanges like to have at least four months trading at the minimum for any given stock (equity) option.
The exchange will ensure that there are ample short term and medium-long term options available for trading. Let’s take the stock Microsoft Corporation (stock symbol: MSFT) as an example.
Microsoft is a cycle #1 stock, meaning that it will definitely have options in January, April, July and October. How do we know? To be honest, despite the fact that we are floor traders, we still had to look it up. You don’t need to memorize this. We just want to provide an explanation in case you wonder why two different stocks have different expiration months available.
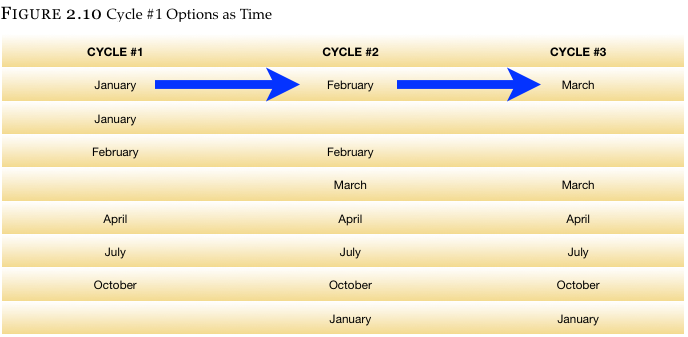
Microsoft will also have options in the two front months for liquidity purposes, so depending what month it is right now, there will be options in months other than what is designated. Let’s walk through an example where we start looking in the first week of January in MSFT.
We know that it will certainly have January, April, July, and October options to start. From there we also know that it will have a second month of February options added for liquidity as most people prefer to trade in the front two months. Once the January options expire, the stock will need two more front month options, so March will be added to the already existing February options.
This next section may seem a tad confusing, but don’t worry. Any decent broker’s site will have all the available months already listed for you.
Trading Hours
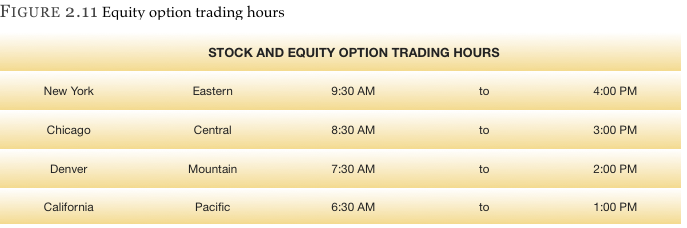
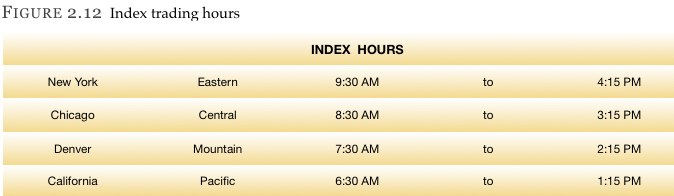 Trading on expiration day continues up to the normal close at 4:00pm eastern time. There is an exception to this – index options trade 15 minutes longer, until 4:15pm.
Note: There are some strange expiration specifications for a few indexes, so always check to make sure you understand how each index expires and settles before investing. Further reading on indexes will be seen later in this text.
Multiplier
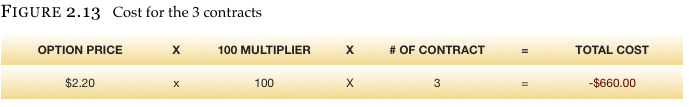
Because most options control 100 shares per contract the term “multiplier” is often used instead of saying “times 100 shares per contract” every time we talk about options. This will come in handy later when we discuss index options that expire into cash instead of shares – but we are getting ahead of ourselves. For now just keep in mind that the term “multiplier” is synonymous with “number of shares per contract”.
Here are a few more examples to help you understand:
* Buying 3 contracts (300 shares of stock equivalent) of a $2.20 call (or put) will cost $660.
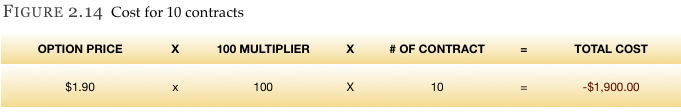
* Buying 10 contracts (1,000 shares of stock equivalent) of a $1.90 put (or call) will cost $1,900.
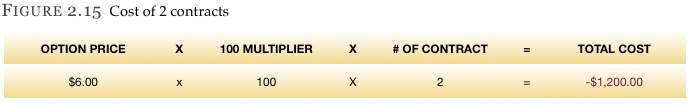
* Buying 2 contracts (200 shares of stock equivalent) of a $6 call (or put) will cost you $1,200.
* Selling 7 contracts (700 shares of stock equivalent) of a $2.95 call will bring in $2,065.
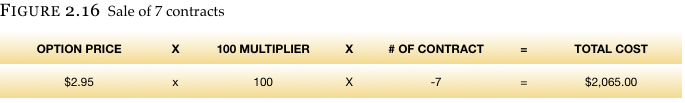
Notice that we bring in money when we sell a call. We will talk more about this shortly, but it is exactly like any other transaction. When a buyer purchases something, he pays money to the individual who is selling the product. Instead of a car, home, or boat, an option is being sold in this example.
People new to options have many questions, and one of the first is probably why options are priced differently.
In the examples we just reviewed in this chapter, the option prices ranged from $1.35 to $6. How do we determine a fair price? This is an excellent question and will be answered now.
The two components of an option’s price are intrinsic value (IV) and time value (TV). Whatever is not intrinsic value is time value. This will make sense in a moment when we go over the two individually.
“Intrinsic Value” is an option’s real value. It is also the portion of the option price when there is no consideration for time.
When determining the intrinsic value of an option, many people think, “What would this option be worth if it were the exact moment of expiration Friday?”
Those who say “options do not have any real value” are uneducated as to what an option truly is. Let’s go back to our PEAR computer coupon. The computers retail for $999. But with the coupon in hand, we can purchase the machine for $599. This is a real savings of $400 – four hundred dollars.
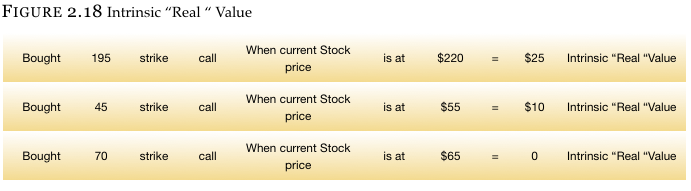
The same phenomenon is at work with options. Suppose that you own the 195-strike call. This gives you the right to buy the stock at $195 per share any time you want prior to the option expiring. You bought it because (as discussed earlier) you felt the stock could make a giant leap up in price, and you didn’t want to miss out on that advance even though you could not afford to own the shares.
If your assumption is correct and the stock advances to $220 (which is not the full $250 you were expecting but still an advance), you will most likely still have a fair sized profit. You know that your option will have real value because you have the right to own stock at $195 and people who do not have the option have to buy shares in the market place for $220 – this is $25 more than you can buy it.
By owning this call, you made $25 per share minus the $1.35 it cost you, or $23.65 per share. With the option of controlling 100 shares of stock, you made $2,365 ($23.65 per share X 100 shares). This is real value. Without the option, you would have to pay $220 per share if you wanted to purchase the stock.
Examples:
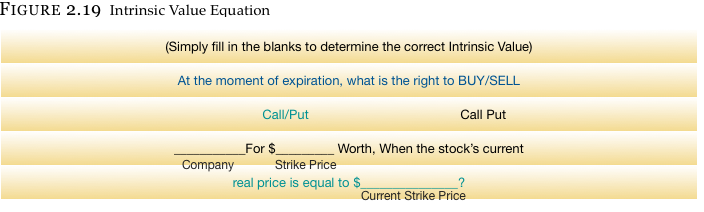
For some people, the easiest way to determine an option’s intrinsic value is to plug the variables into an equation. More than one trader at Random Walk mentioned how they did this process in their head when first learning options. Their thinking process is in Figure 2.19:
We can use a call option and plug it into the previous equation, and you will notice just how easy things are when you follow the math. Suppose we are looking at the 195 call in PEAR and assume that the stock is now trading for $214. What is the intrinsic value of the call?
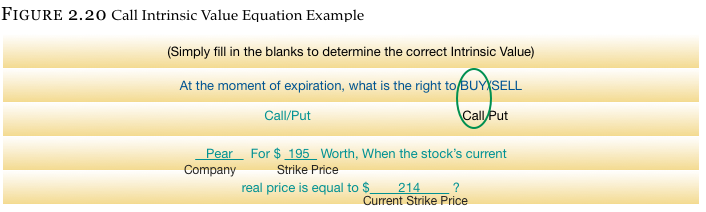
This call obviously gives us a $19 advantage over people who don’t own it, so the answer is $19.
Plugging a put into the equation works the same as the call. We previously looked at the 190 strike put in PEAR that cost $1.50 per share to purchase. If the stock moves to $177, finding out the intrinsic value should be easy.
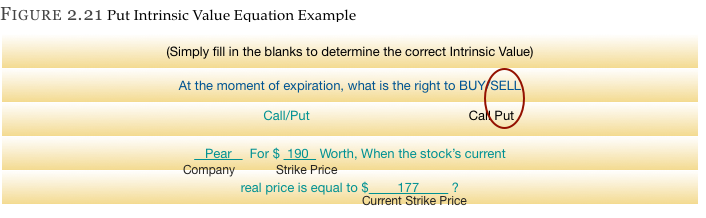
This is put obviously gives us a $13 advantage over people who don’t own the protective put, so the answer is $13.
We saw how a call option with a strike price lower than the stock price had real value. This “intrinsic value” does not have to exist for the option to still be worth something. At first, this may go against common sense, but an explanation should clarify it.
Keep in mind that an option cannot have a negative intrinsic value. It has real value or it does not have real value – but it CANNOT have a negative intrinsic value. When we bought the 195 strike call in PEAR, it didn’t have any intrinsic (real) value. The stock was trading for $192, and we bought an option for $1.35. This has to move up $3 to get to the $195 strike. For it to have intrinsic value, it needs to move more than $3 higher. Yet it was trading for $1.35 because you were buying time.
Time value is defined as the portion of the option’s price that is not intrinsic value. In other words, it is the portion of the option price where you pay for opportunity and time.
When you bought the automotive insurance for your ultra-sleek Random Walk Spider 600 series car, you bought a $30,000 policy to protect a $30,000 car. The insurance policy has no real value. No one calls up their insurance agent after buying a car and tells him to take the car off their hands. They usually wait until they hit a tree or the car is stolen and the car is not worth anything. Yet, the policy cost you $1,000. Why does the policy cost money if it has no real value at the time? When you send a check to your agent, you buy one year of protection. You are buying time. The same theory works with options.
We know that the PEAR 195-strike call is worth nothing from an intrinsic value point of view because no one would exercise their right to buy the stock for $195 when the stock is at $192. $192 is a better value. Yet the $195 call will cost the buyer $1.35 for the opportunity to buy the stock at $195 per share should the stock run up in price.
We already demonstrated how time value was defined as the portion of the option’s price that is not intrinsic value, so determining the time value of an option is straightforward. You only need to take the price of an option and subtract its intrinsic value (if any) – what remains is time value.
We saw earlier that the 190 strike put in PEAR was trading for $1.50 per share ($150 per contract as each contract controls 100 shares). When the stock is at $192, we would obviously be able to receive $192 if we chose to sell the stock. If we elected to sell the stock by exercising the put option (which gives us the right to sell the put at $190 any time), you would only be able to sell the shares at $190. We would not want to use the put, which means it has no real intrinsic value. Yet the put costs $1.50.
Like the insurance policy on the car, the stock insurance policy costs $1.50 (per share) for the protection it provides between the time it is purchased and the time it expires. The car insurance would pay off if you got into a car accident, and the cost of the put would pay off if the stock market fell. If you do not get into a car accident, the insurance policy will expire worthless, and if the stock does not decline, so will the put option
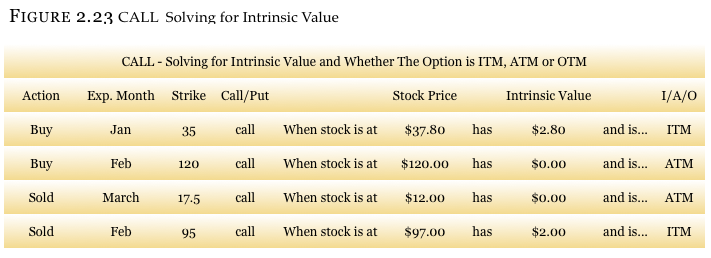
The terms intrinsic value and time value are a little too formal for most people, so traders came up with another term for the same thing(s). Do not be intimidated by yet another set of new vocabulary terms – these are not too difficult.
In-the-money (ITM) and out-of-the-money (OTM) are terms used to designate whether the option you are looking at has real/intrinsic value. If the option has intrinsic value it is referred to as being “in-the-money”, or ITM. Those options that do not have real value are called “out-of-the-money”, or OTM.
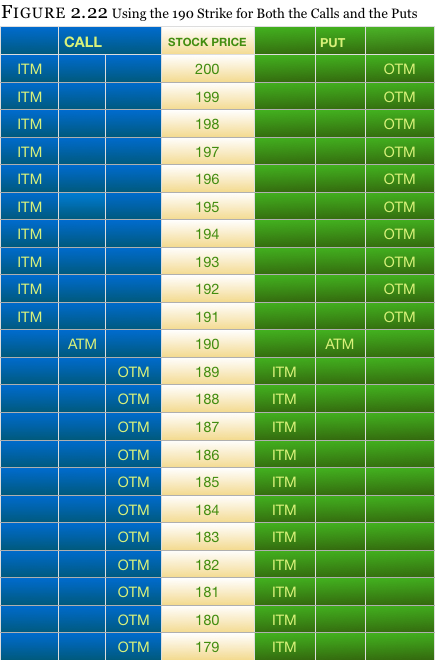
You will also hear of the term “at-the-money” or ATM. This refers to the strike price that is closest to the current stock price. With PEAR trading at $192, you are looking at a choice between the 190 and the 195 strike. The strike that is closer to $192 (the stock price) is the 190-strike. We would refer to this as the “at-the-money strike”.
For some, the race horsing analogy will be beneficial. You may have heard someone say, “My horse came in-the-money,” meaning that they made money on the ticket they purchased – be it win, place or show. Options work the same way. If you have an option that is ITM, it has intrinsic value.
If you are still confused about the concept, simply go back to the original intrinsic value equation. There is another way to think about this:
The terms intrinsic value and time value are a little too formal for most people, so traders came up with another term for the same thing(s). Do not be intimidated by yet another set of new vocabulary terms – these are not too difficult.
In-the-money (ITM) and out-of-the-money (OTM) are terms used to designate whether the option you are looking at has real/intrinsic value. If the option has intrinsic value it is referred to as being “in-the-money”, or ITM. Those options that do not have real value are called “out-of-the-money”, or OTM.
You will also hear of the term “at-the-money” or ATM. This refers to the strike price that is closest to the current stock price. With PEAR trading at $192, you are looking at a choice between the 190 and the 195 strike. The strike that is closer to $192 (the stock price) is the 190-strike. We would refer to this as the “at-the-money strike”.
For some, the race horsing analogy will be beneficial. You may have heard someone say, “My horse came in-the-money,” meaning that they made money on the ticket they purchased – be it win, place or show. Options work the same way. If you have an option that is ITM, it has intrinsic value.
If you are still confused about the concept, simply go back to the original intrinsic value equation. There is another way to think about this:
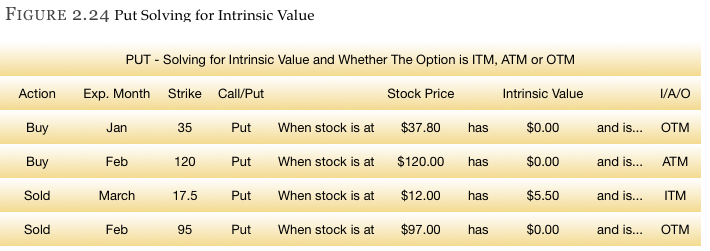
- Calls have intrinsic value when the strike is lower than the stock.
- Puts have intrinsic value when the stock is lower than the strike.
The next example will illustrate how to find out if the option is in or out-of-the-money, and will also show the amount of intrinsic value in the option. Look over this material for a few minutes and it will sink in. The first set will be with calls and the second set will be with puts.
Volatility is usually defined as the amount a stock (or commodity, index, etc.) moves in a given period of time. The time period can vary depending on the individual’s desired measurement, but let’s use one year as the initial example.
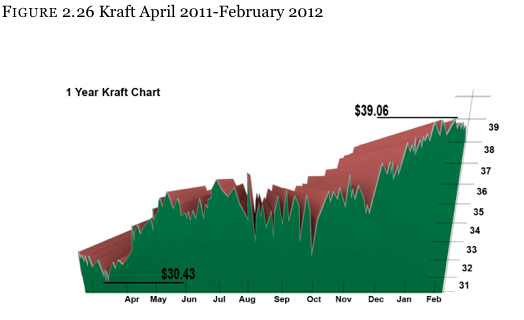
The best way to explain volatility is through the comparison of two different stocks both trading at the same price. Comparing Kraft foods (KFT trading at $32.20) and Adams Resources (AE trading at $32.28) both trading within $0.08 of each, you would think that the stocks would have something in common. Yet, when you look closely at the performance of the stocks for the past year, you will notice that they trade in dramatically different ways.
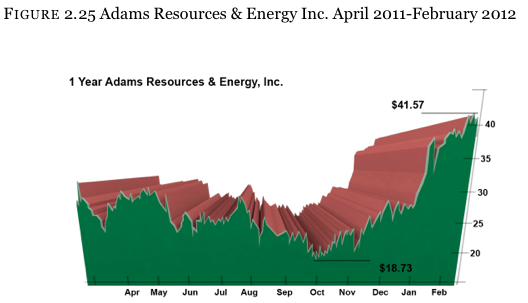 Kraft foods traded in an $8.63 range (high = $39.06, low = $30.43) while Adams Resources traded in a $22.84 range (hi = $41.57, low = $18.73). In other words, Adams Resources moved in a range of close to three times (2.65) as large as Kraft. This indicates that Adams Resources has been much more volatile for the last year.
Some people have a better understanding of how these two stocks compare to one another when the two stocks overlap on the same chart. The next chart shows Kraft as a solid line and Adams as a jagged line (known as an “open, high, low, close chart”). It is more obvious from this chart that Adams is roughly three times as volatile as KFT
You just saw how two different stocks trading at the same price can move in totally different ways, just like how two kids from the same parents can have totally different personalities. This is why option prices are what they are.
Think about the story of the Three Little Pigs from when we were children. There was a house made out of brick, one made from wood, and the last made from straw. Upon hearing news of a wolf in the neighborhood, they called their insurance company. Which home do you think cost the most to insure? Which the least?
Obviously the cost of insurance for the brick house was the least expensive and the straw house was the most expensive. Why? The straw one has the highest probability of burning or blowing down, which would cost the insurance company money to replace. The same idea is at work with options on stocks.
We know that Kraft stock (1 year range of $8.63) is very stable when compared to Adams Resources (1 year range of $22.84). Because stocks have the same probability of moving down as up (this will be discussed later), both the upside calls and the downside puts should be more expensive for Adams than Kraft. Imagine that the stock market is in a large bull market (in other words, the stock market as a whole is going up dramatically.) This will help us think in more simplified terms to get a tangible feel as to how options are priced.
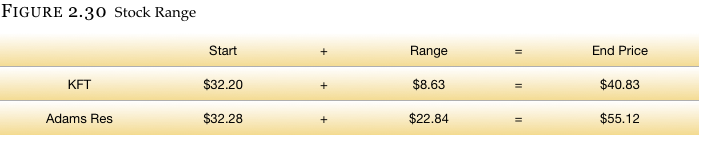
Let’s assume that both stocks will move the same amount this year as they did last year, but because of the bull market, they will only move higher (instead of up and down). We know that this is not how things happen in the real world, but it will make this example easier to understand. We also know that both stocks are starting at about the same price of $32.20, but will run higher by the same amount as last year’s normal range (Kraft = +$8.63, AE = +$22.84).
Now suppose that you had the following one-year-until-expiration options from which to choose. Which would you prefer to purchase knowing that they both cost $2, have one year of time to make money, and allow the owner to buy the stock at $40 any time?
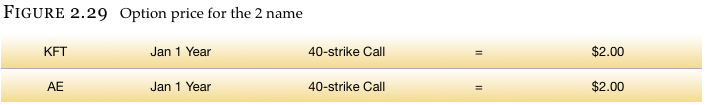
If you have not figure out the answer yet, perhaps the pieces will start fitting together as we continue. Recall that the 40 strike call allows the owner to buy the stock at $40 at any time. So when would you want to buy the stock for $40? Only if you could sell it at a higher price, like $45 per share.
Looking at Figure 2.30 reveals our answer. Going off the assumption that each stock will move higher by the amount it moved last year, we see that Kraft will end the year at $40.83 while Adams will end the year at $55.12. Since both options allow us to purchase the stock at $40 per share, and since they cost the same amount, we would prefer the Adams calls over those of Kraft.
There will always be some naysayers who say, “But I know Kraft. I buy all their products. I have never heard of Adams. I would rather own the Kraft calls.” That is fine. You can go out and buy the Kraft calls, but you will not make money. And just what will our profits for each of the calls be one year later?
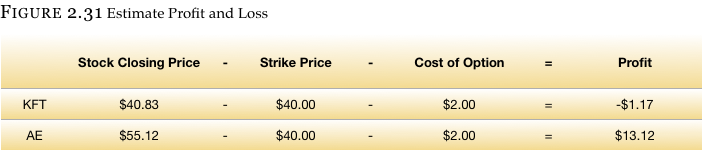
Here you will notice that the Kraft option actually lost money. The stock went from $32.20 up to $40, but money was lost because the stock did not climb high enough for the call to make back the initial $2 investment. This does happen and can be very frustrating. You bought an instrument that was supposed to make money when the market went up, then the market went up, but you lost money. Please do not get discouraged yet; the two scenarios listed below will hopefully get you interested once again.
- Sell the call – If buying the call did not work out even though the stock went up, why not sell the call and take in the $2 (instead of paying it out)? What if the stock didn’t move for one year or went down in price? Then we should make money, right? Yes, and we will get to that shortly.
- Options trade at different prices – Many people reading this may think about what just happened and say that it is obvious that they want to own the call in Adams and not Kraft. Since both options were the same price, many people will just buy a call in the stock that moves the most and ignore the stock that doesn’t move.
Afterwards, the Las Vegas thinkers will begin to realize that the Adams call is worth a lot more than the Kraft option, so it should be trading higher. As a matter of fact, they will state that the Kraft call is too expensive and the Adams call is too cheap – and they are right.
Figure 2.32 example illustrates why the same option (strike and time until expiration) in two different names will be trading at different prices even though the cost of the stocks are the same.
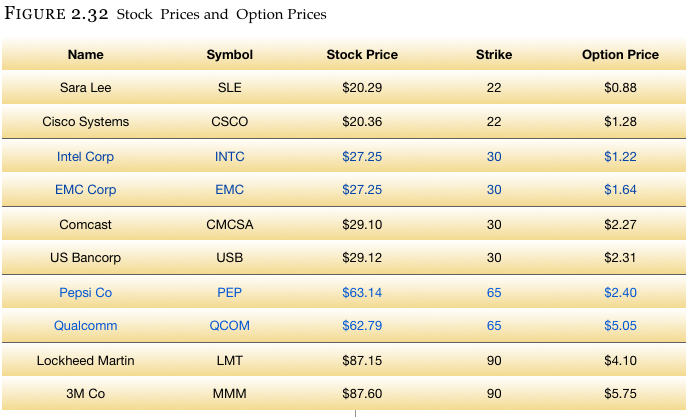
Here are some examples of instances where the stock prices between two companies are almost the same, the time until expiration is the same (331 days), and the strike prices are the same; yet, the price of the options are different. Why? The stocks themselves move on different volatility levels. Remember that a straw home will move more than a brick home in the wind, and that is why the put options (insurance policy) are more expensive.
Relax,
Thus far you should be keeping up, even if only by your fingernails. A little frustration is normal. You are being provided with a lot of new information all at once, but we want to assure you that everyone is capable of grasping this material. It may take a second reading, but it is very realistic to assume you will know this information in no time. As a matter of fact, this is the most difficult part of option trading. Once you grasp these concepts, the rest is much easier. If you are having no problems so far, then congratulations are in order – you may be a natural.
CHAPTER 7: VERTICAL SPREADS
In Chapter 5, we saw that buying a naked long call or put could result in a significant profit should the stock make a dramatic move in the correct direction. As a matter of fact, the potential profit on a naked long option is theoretically unlimited to the upside and almost the entire value of the stock to the downside. This can be enticing to someone who is prone to gambling since it is the equivalent of picking the correct roulette number on a wheel. In reality, markets don’t often make major moves.
Vertical spreads are designed for trading in more subdued and normal market conditions. Yes, markets can move quickly and strongly in one direction, but under most circumstances, the markets do not move much from one month to the next. This is where a vertical spread can triumph over a naked option in both risk exposure and return on investment.
Long Call Vertical Spread Analogy
Suppose you had your eye on a very fast and sleek new car from Random Walk Motors, but the vehicle cost $70,000 – about $20,000 more than you had in your budget. Despite the cost, you just have to have it, and it is easy to rationalize.
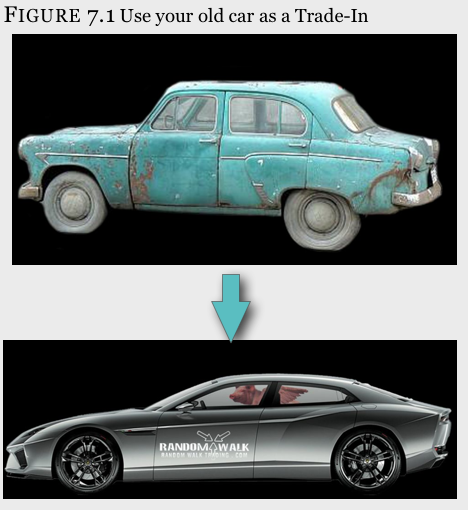
The solution? Use your old car as a trade in.
You will simply find a dealer who will take $20,000 for your slightly used 1978 vintage vehicle that you only drove to the races on the weekends. The $70,000 list price of the car minus your $20,000 trade-in will bring the cost down to what you can afford – $50,000. This is the same exact thing as a call or put spread, but instead of buying the car you want and sacrificing your old car, you will buy the call you want and sell a call that you think is so far out-of-the-money that the stock can’t reach it.
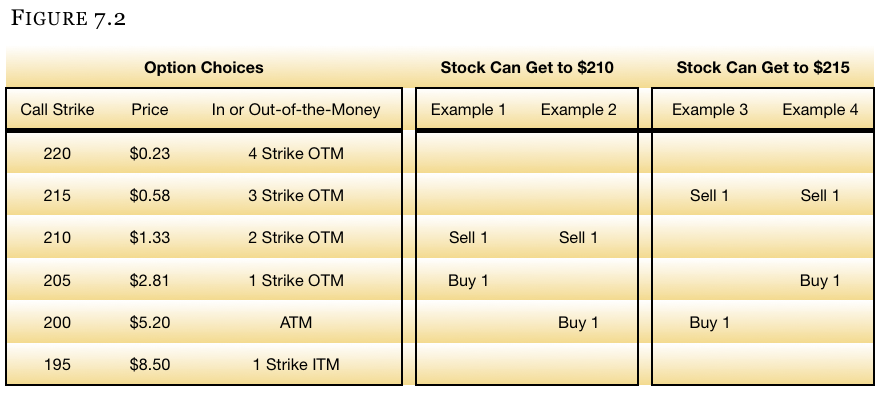
For example, suppose that you think the stock can go no higher than $210 by expiration with the stock currently at $201. All you have to do is purchase the call that you would want to buy normally, and then sell the $210 call to help offset the price.
Looking at Figure 7.2 (specifically in example #2) you will notice that, if you elected to buy the 200 strike call, it would cost you $5.20. By selling the 210 strike call against it, you will receive $1.33. The debit from the 200 call purchase minus the credit from the sale of the 210 call will result in a spread that costs only $3.87 ($5.20 – $1.33). This is an investment of $387 per spread, which comes out to be a 26% discount compared to having to pay for the naked long 200 strike call.
Definition
A long vertical spread is the purchase of a call (or put) and the simultaneous sale of a further out-of-the-money call (or put) in the same expiration month.
Graph
In chapter 5 on naked option purchases and sales, we introduced the profit and loss (PNL) graphs as a tool for picturing how the options move throughout the entire spectrum of possible stock prices on expiration. This same graph is now brought back to illustrate what a vertical spread looks like.
Figure 7.4 is a graph of the long 200 strike call, short 210 call, and the graph of the vertical spread (the two calls combined).
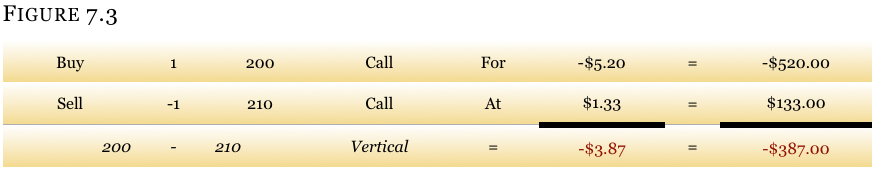
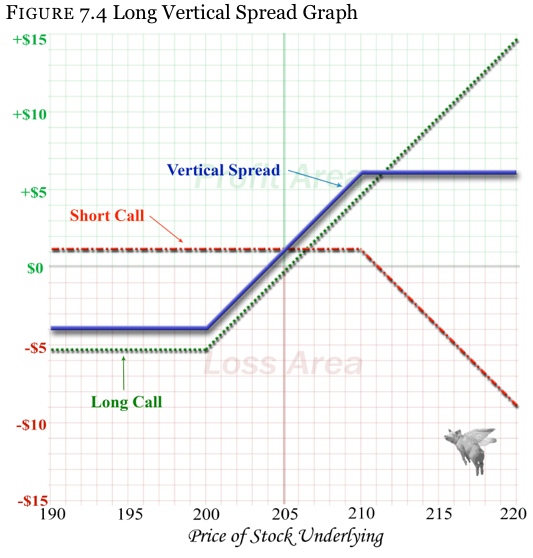
Figure 7.5 is how the long vertical call spread purchased for $3.87 looks as the stock moves up or down at the time of expiration (when all the time value is gone)
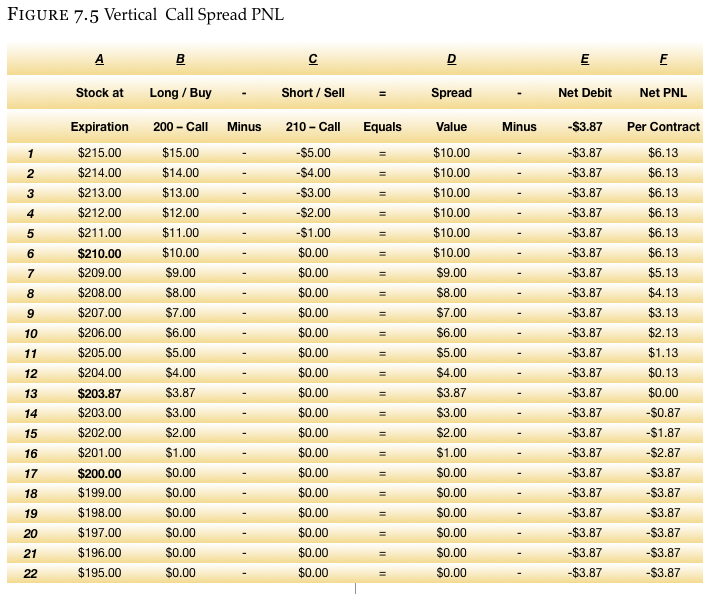
Vertical Call Spread PNL Explained
The Figure 7.5 table provides a lot of detail about the 200 – 210 call spread.
- Column A
This column is a list of possible stock prices at expiration. Though it is not inclusive of all possible closing prices, it has a $5 range above and below the strikes of the vertical.
- Column B
This is the value of the 200 strike call at expiration given the closing price in column A. It does not have the price of the option paid in it as that is covered in the “net debit” column (column E).
- Column C
This is the value of the 210 strike call at expiration.
- Column D
This is the value of the spread (200 call – 210 call) at expiration – not including the cost of the spread. You will notice that the value of the spread where the strike prices are $10 apart (210 and 200) maxes out at $10, and goes down to zero.
Also notice that the maximum profit is made at the strike price sold – the 210 strike in this example (column D, row 6). If the stock continues higher to $211, $212….$215, the same $10 profit is made.
- Column E
Net Debit column is the amount paid for the spread.
- Column F
This is the net profit or loss of the spread at expiration after the cost of the spread.
We already saw how the vertical call spread works as the price of the stock/underlying moves up or down. Yet this does not address the benefit of the spread completely. Yes, we saw that buying the vertical spread instead of the naked 200 strike call will save you 24% on your investment costs and risk, but you are giving up the unlimited upside potential that the naked long call has. Even so, a stronger argument can be made for the vertical spread rather than the naked call.
The vertical spread will be of tremendous advantage over most normal market conditions as we will see below when we compare the amount that the stock has to move for the naked long call to outperform the vertical spread.
In Figure 7.6 please notice how the two shaded areas compare to one another. The first shaded area is that of the call spread’s net profit or loss as shown in the previous table. The second shaded area (on the right) is the profit or loss on the naked long 200 strike call purchased for $5.20. There are, however, a few important observations that should be made.
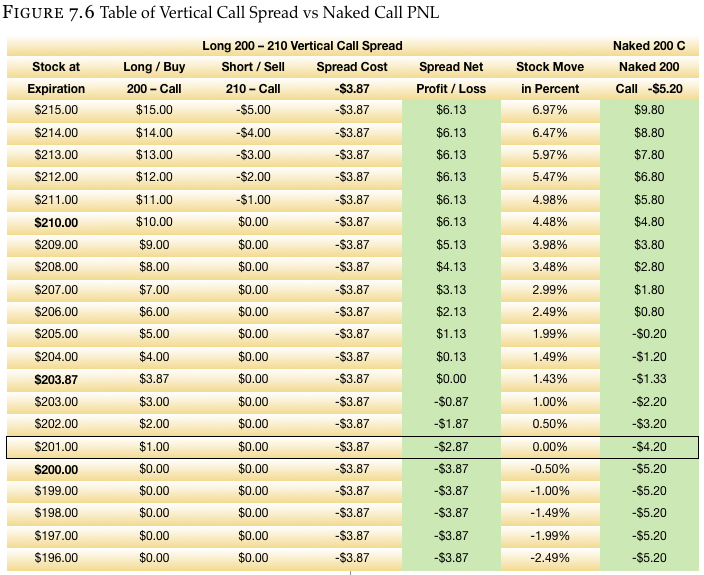
- Observation 1
We can see that the spread breaks even at $203.87 when the stock is only up 1.43%. Yet at the same price, the naked long call closes out at a $1.33 loss. At this price, the vertical spread outperforms the naked long option, but let’s continue going up in stock price.
- Observation 2
If you move up the stock price to a point where the naked call roughly breaks even (for our case, we will call it a stock price of $205), we see that the call spread is at a profit of $1.13, even though the naked call is roughly at a break-even point (-$0.20). Again, the call spread is showing an advantage to the naked call, but we must keep moving up in share price to get a fair comparison.
- Observation 3
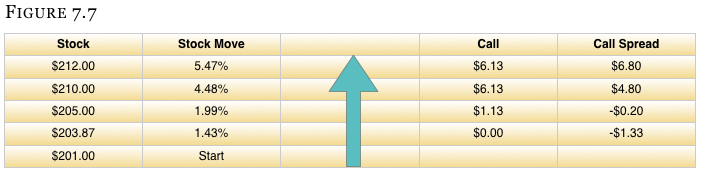
Looking at a stock price of $210 per share which is $9 higher from the start price of $201, we see that the vertical spread is up $6.13 and the naked call has a profit of only $4.80. The stock had to run up almost 4.5% in one month’s time, and the vertical spread still beat the naked call. As with the previous examples, let’s keep moving up the price of the stock to see where the two trades are at parity.
- Observation 4
The stock price must move up to $212 for the naked call to outperform the vertical spread. Then, after the call spread maxes out, the naked call will continue to make money as the stock moves higher. Yet this is an $11 run higher and a 5.5% rise in the price of the stock. As tempting as it sounds to own the naked call, how often does a stock move up more than 5% in a month? Under most circumstances the call spread will outperform the naked long call.
Selling Call Analogy
We previously touched on this when we were looking at remedial stock and option basics, but this is often where a few people begin to have questions about the vertical spread. Many people ask, “How can you just go and sell the 210 call if you never bought it in the first place?”
We called it “selling short” in the stock section’s examples. And it is the same thing as buying a call option and selling it later, but in reverse.
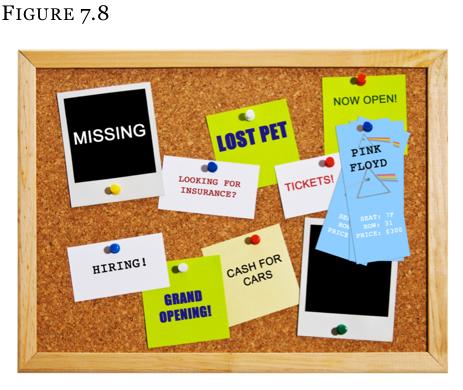
Think of selling a call you don’t own like selling a concert ticket to a distant acquaintance. You notice a sign on the public bulletin board at the local grocery store saying, “4 Pink Floyd Tickets – $300 Each.” Later in the day you bump into this guy you know from a friend of a friend, and he says “Do you know anyone that has tickets to tonight’s Floyd concert, man? Dude, I would pay like $500 each for up to four tickets.” Let’s call your acquaintance Abbey Normal.
 Since you don’t particularly care for Abbey and because you need the money, you tell him, “I can get you 4 tickets.” This should be an easy $200 profit on each ticket. You remember the sign at the store and you will call the guy to get the ticket. Once you have the tickets you will give them to Abbey.
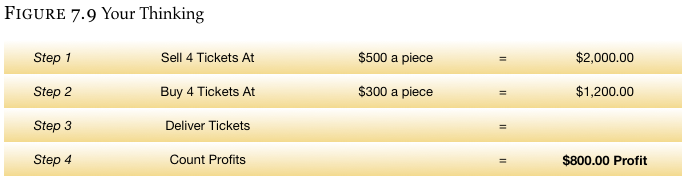
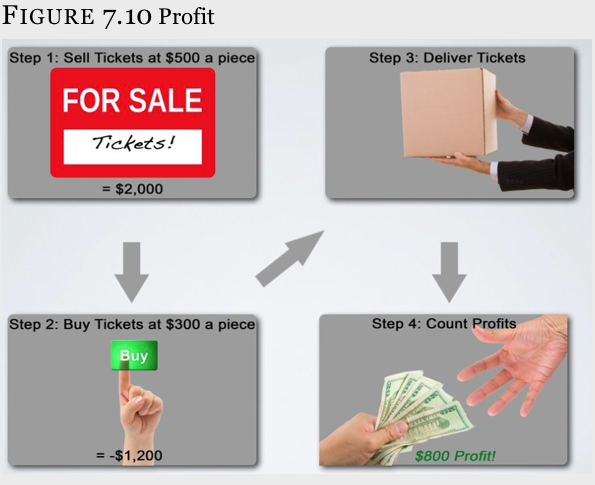
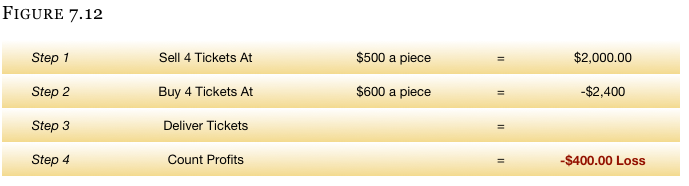
So you take the money from Abbey and set off on your journey after promising him you will get the tickets. You now have to deliver the tickets. If you can get the tickets from the individual selling them on the bulletin board your day is easy and you have an $800 profit ($200 for each of the 4 tickets). If the guy selling the tickets on the board cannot be reached or has sold the tickets, you have to figure out real quick how to get 4 tickets.
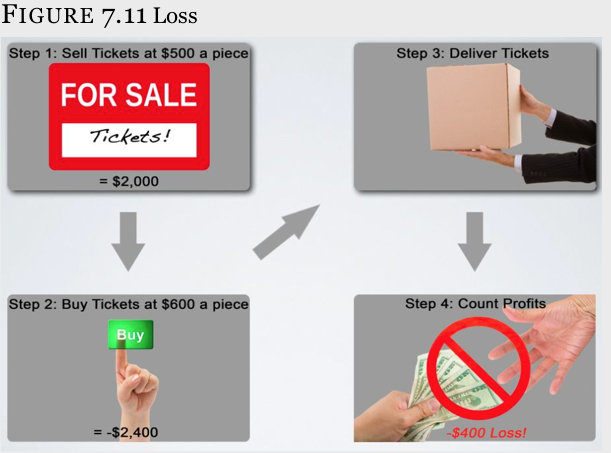
Worse yet, if you don’t get the tickets from the guy posting the advertisement on the bulletin board, you might have to pay more than $500 per ticket from someone else, thus you might be facing a loss. If the only place you can find tickets is from a guy selling them at $600 per ticket and you took in $500, you will have to deliver the tickets nonetheless. This will result in a $400 loss to you ($100 per ticket). Yet it is a risk you decided to take.
Maximum Profit
As you might have gathered by this time, the maximum that can be made on a vertical spread is the distance between the strikes – minus what you paid for the spread. In the example we have been using, we bought a spread that was $10 wide (bought the 200 strike and sold the 210 strike). Since we paid $3.87 per share for this spread, we can make $10 minus $3.87, or $6.13 per share. Each contract, therefore, is a maximum profit of $613 in this particular example ($6.13 per share multiplied by 100 shares per contract). Had we paid only $2.50 for this spread, we could have made $10 – $2.50, or $7.50 per share.

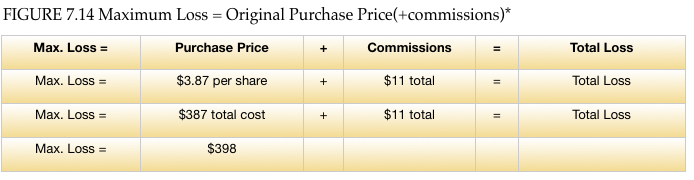
Maximum Loss
And like most things in life, the most you can lose on it is what was spent. When you spent $3.87 per share on the spread, the most that could be lost is the original $3.87 investment even if the stock went to zero. If you had bought a car for $38,700 and drove it into the lake, never to be seen again, and you never bothered getting insurance on the vehicle, then you would have lost $38,700.
* Don’t get confused here when you see “-” and “+” around the commissions. You will always be paying commissions on your trades. Brokers do not have a charitable side to them. The negative and positive signs are there to show where the broker will take the commissions cost. For illustrative purposes, we will simply state that the cost of commissions to buy and/or sell this spread is $11. Different brokerage firms have different commission schedules and rates.
The maximum profit has a negative sign associated with it because the commissions will be taken away from your profit.
The maximum loss has a positive sign associated with it because the cost of commissions will be added to the loss.
And just as you bought the call spread, someone else had to have sold it. When one person makes money, the other loses an equal amount. If the buyer is making $2 per share, the seller has to be losing an equal amount. Likewise, if the stock were to go down, the seller would be making money while the buyer loses money.
In the example above, we saw that the stock had started at $201 per share, but had to rise 1.43% to $203.87 for the spread to even break-even. This was more favorable (under most circumstances) to being long a naked call, but the stock had to run higher to break-even nonetheless. Seller’s Benefits
The buyer of a stock, a call, or a call spread can only make money if the stock appreciates upwards, but the seller of the call spread has 3 ways to make money:
- Market Stays Unchanged
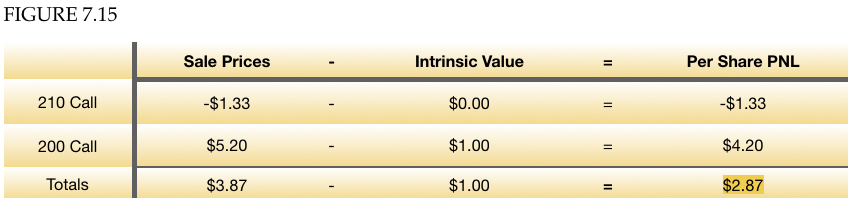
If the market closes at the same place it started at the beginning of the month (in our case, with a stock price of $201), the 200 – 210 call spread will expire worth only $1. The buyer will lose $2.87 of his $3.87 investment, but the seller gets to keep the entire sale price of $3.87 minus the $1 of intrinsic value he has to give back. Thus, the seller of the spread will be allowed to keep $2.87 per share ($287 per contract) with the stock at $201.
- Market Declines
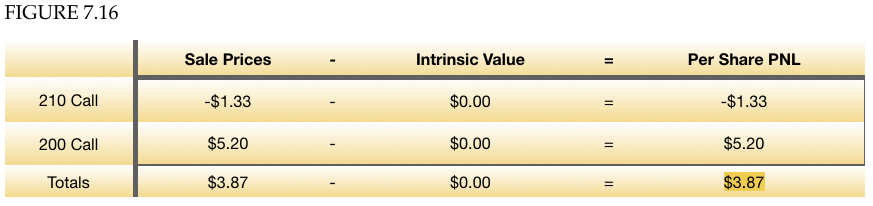
The best thing that can happen to the buyer of the call spread is for the stock to run higher immediately after purchasing the spread. The reverse is then true for the seller of the spread who is hoping that the stock declines immediately after the spread is sold. So long as the stock closes below the lowest strike price, neither call will have intrinsic value at expiration and the spread will expire worthless or is worthless.
If the spread is worth nothing on expiration it can be bought or sold there. Thus, if you sold the spread at $3.87 and it is worthless, it is the equivalent to getting the spread for free and selling it at $3.87 – but in reverse. A $3.87 profit per share will be realized.
- Market Advances Slightly Even
If the stock advances a small amount, the seller of the vertical spread can still make money provided the stock does not move beyond the break-even point which is calculated as follows:
Vertical Break-even = Closest to ATM strike + Spread Price
Because the closest to at-the-money strike is 200 and the cost of the spread if $3.87, the break-even is $203.87 ($200 + $3.97). So long as the stock is below $203.87 at expiration, all of the premiums collected will be kept.
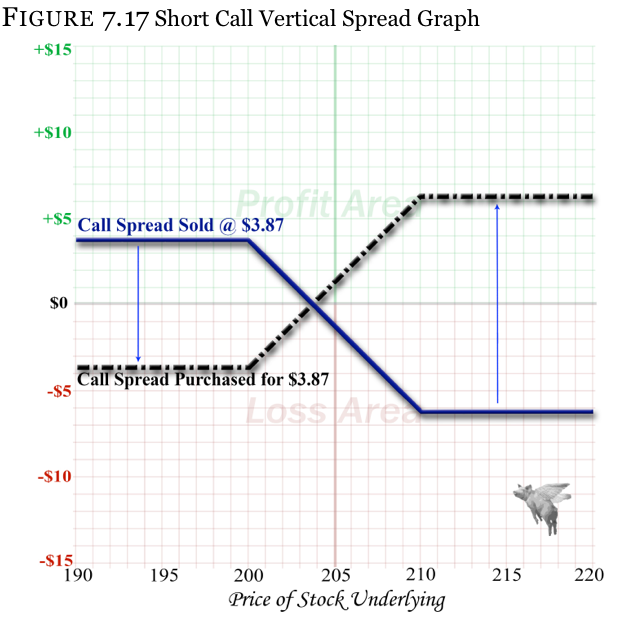
Short Call Vertical Spread Graph
Perhaps the best way to visualize how the sale of a call vertical spread works is by looking at a profit and loss graph, and then comparing it to the purchase of a call spread. The following graph shows the long call spread and short call spread on top of one another. The faded dashed line represents the spread purchased for $3.87 that we previously saw. Meanwhile the dark line is that of its seller.
Notice how the two lines are mirror images of one another. Whatever the seller of the spread makes, the buyer of the spread will lose, and vice versa.
Like all of the strategies we have shown so far, entering a vertical spread is no more complicated on most broker trading platforms. Below you will notice that the call vertical we have been discussing has been entered into the trading platform and is ready to send to the trading floor for execution. Please take further notice of the price of the spread being a $3.87 debit.(Figure 7.18) This debit price is all that is entered.
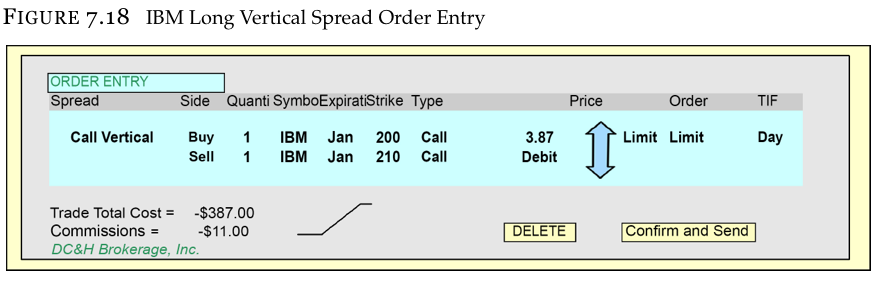
Entry Price (Long Call Vertical Spread)
We were analyzing the vertical spread when the 200 strike call was trading at $5.20 and the 210 strike call was trading at $1.33 to give us a net debit of $3.87 per share ($5.20 – $1.33 = $3.87). Since the markets are changing every moment of the day, it is not necessary to be filled at those exact prices. As a matter of fact, you are rarely filled at the same exact prices the options were trading for when you looked at the spread initially. Our only concern is that the trade is not filled at a price higher than $3.87, and if the broker can buy the spread at a lower price he/she will. The $3.87 is simply a limit price that you have instructed your broker that you are not willing to pay anything more for.
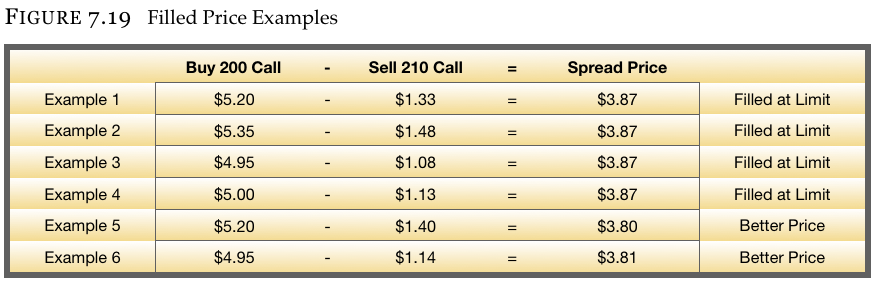
Depending on if the stock advanced or decline at the time you placed the order, and depending on where the broker chose to fill the order(s) in the middle of the bid and ask spread, you could see any one of the fill prices in Figure 7.19.
Up to this point we have solely been concerning ourselves with call verticals. We are not trying to diminish the role that put spread plays in the investment world; rather we purposely avoided skipping around so we didn’t add to the confusion. You will find in your further studies that the call spread and put spread are intricately linked to one another and can be used in conjunction with one another to create hedging and arbitrage opportunities.
You probably have gathered by this point that if a call spread can enhance your chances of success over a naked long call, then the put spread will likely enhance your chances of success over a naked long put. And the great thing about put spreads is that they work the same way as call spreads with the exception of you having a bearish opinion instead of a bullish one (This means that you think the market will decline rather than increase).
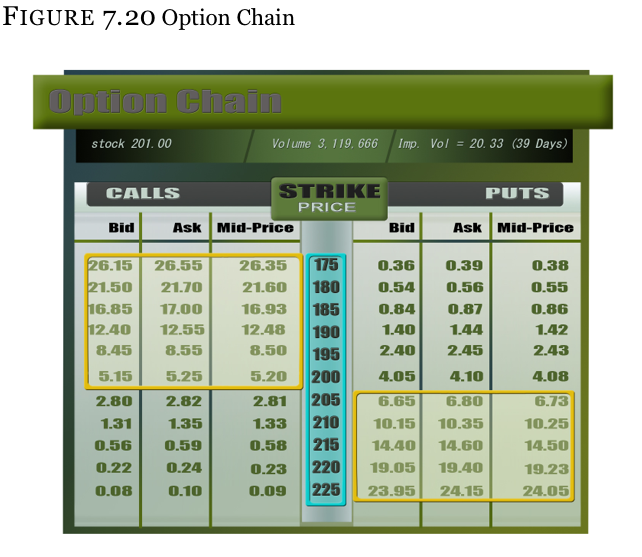
So instead of believing that the stock is advancing, let’s examine what a put spread looks like when we have an inkling that the stock (bond, commodity, ETC, etc.) is going to decline in value. For consistency we will go back to the same option chain we have been working with to date.
It doesn’t matter how much you think the stock can go down. That will be different for every stock and the conditions in the overall market at the time. This will be addressed in the criteria portion of this chapter momentarily.
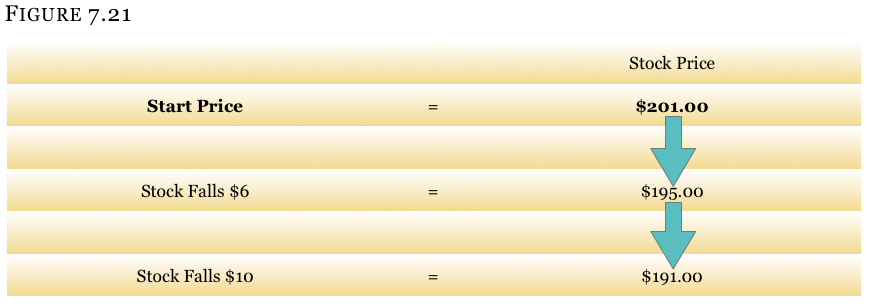
- Stock falls $6 to $10
Making the assumption that a fall of $6 is probable and a fall of as much as $10 is possible, we have a couple of choices to make with regard to the put spread.
Knowing the possible outcomes for this stock, a choice of spreads will be created from which you can choose what best suits your tastes.
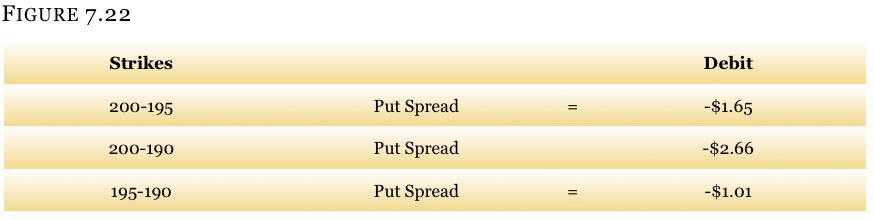
- Choice A 200-195 Put Vertical Spread
Because we know that the stock is starting at $201 and likely going down from there, we can start with buying the ATM 200 strike. The obvious choice would be to sell the 195 put against it, thus turning this into a $5 wide spread. Since we feel that the stock can get down to $195 with a good degree of certainty, selling the 195 put against the 200 strike puts purchased is a logical decision.
- Choice B 200-190 Put Vertical Spread
We can also look at buying the same 200 strike put, but selling a further out-of-the-money (OTM) put to take advantage of a possible drop of more than $6. We already learned that the maximum that can be made on the spread is contingent on how far OTM we sell the put (or call in call verticals). Thus, when we sell the 195 put, the stock dropping further below $195 does not provide us with any more of a profit. Yet, if we move the strike being sold from 195 down to 190, we will have on a $10 wide spread (200 – 190), albeit at a higher investment cost.
- Choice C 195-190 Put Vertical Spread
By now you may have noticed that the spread is cheaper to purchase as it goes further OTM. You might have even said to yourself, “Why buy a $5 ATM spread like the 200 – 195 for a $1.65 debit when I can move everything down 1 strike to the 195-190 strike spread which will only cost me a $1.01 debit?”
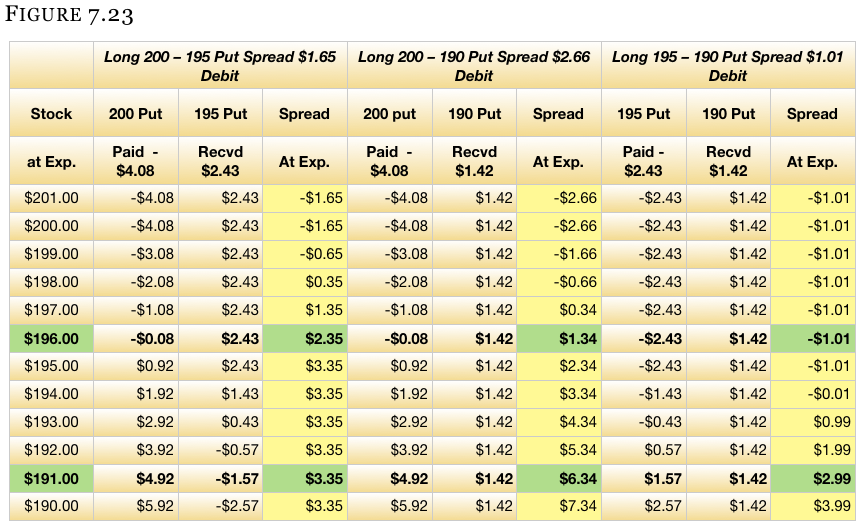
Depending on many variables (the amount that the stock can move, support levels, if the stock is in a bear or bull market, etc.), it may be a good idea to buy a cheaper and further out-of-the-money spread provided the stock has a reasonable chance of falling enough to make the spread worthwhile. This will be addressed in the criteria section of the material. In the meantime, let’s assume that we will only evaluate the 3 spreads mentioned so far:
The math for evaluation is set up in Figure 7.23.. The highlighted columns are the 3 spreads’ net profit or loss at expiration. The bold text highlights the stock prices we predicted of $195 and $191. Looking at Figure 7.23 will assist you in determining which spread best meets your objectives and opinions.
Other Terms
Like any other industry, jargon is created out of nowhere and for no apparent reason. Instead of keeping things simple, someone says something and it grows roots. The table below is a list of other names for vertical spreads. Do not feel obligated to learn all the terms or think that memorizing them is required for successful trading. The broker’s website you use will likely describe them as “vertical”. The list below is written in order of frequency and correctness; the most correct terms are first.
Comparison Among Choice A, B and C
Which of the three spreads is the best? This is the difficult thing about trading, and you really only know the correct answer at expiration. Yet you do not have the luxury of a crystal ball to look into the future, so a decision has to be made.
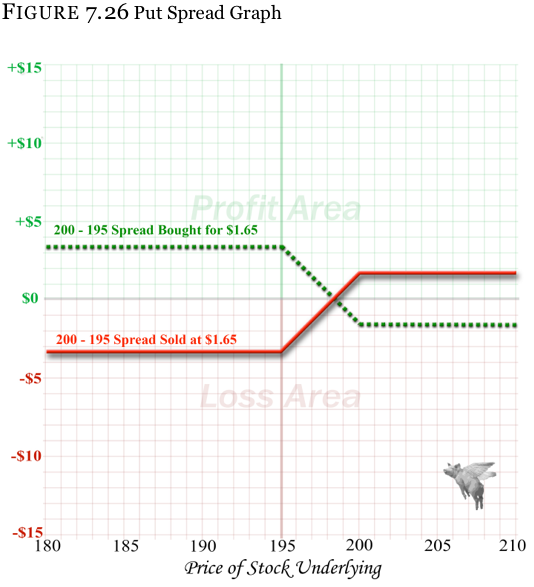
For some, a graph of the profit and loss of the long put spreads will make the decision easier. Next is the graph of all three vertical spreads so you can compare them. When viewing the graph, keep the three stock prices in mind:
1. Stock Starting Price of $201 – What if the stock closes unchanged in a month?
2. Stock Down $6 – What is the profit at $195 compared to what it would be if the market moves in the wrong direction?
3. Stock Down $10 – What do the different strategies make at $191 compared to if the stock moved in the wrong direction? Keep in mind that there is a much higher probability of the stock moving down $6 than $11
Fungibility
Don’t fret about how to close the trade when the time comes. Options are fungible, meaning you do NOT have to sell the spread back to the original trader. When you buy a stock and sell it out later, you do not seek out the same guy you did the original trade with to see if he will trade again. You bought from one individual, sold to another individual, and the stock got taken out of your account. The same thing occurs with a spread.
Just like with call spreads or naked options, anyone wanting to buy a put spread needs it sold to them. Someone will be on the other side of the trade. You think that the stock is going down, but meanwhile someone on the other side of the trade is thinking that the market is going to stay steady or run higher.
So, just as with the call spread example where we compared the purchase and sale on the same graph, we can do the same with a put spread to show how they too are mirror images of one another. We will compare the purchase of the 200 strike – 195 strike put spread for a $1.65 debit to its sale. Remember, that, when someone buys the put spread, they are hoping the market goes down and pays the premium. The seller hopes the market advances and he receives the premium.
Table
Some people will want to see a mathematical comparison throughout a range in the stock between a long spread and a short spread side-by-side. Figure 7.27 table shows how the buyer and seller of the same put spread we discussed above will actually share an equal and opposite profit and loss risk profile.
When looking at the table, you will notice a horizontal and vertical highlighted area. The horizontal area that has been highlighted shows the area between the strikes of the spreads. The vertical area has been highlighted shows the net PNL columns of the two spreads. This will make the profit or loss of the long spread easier to compare with the profit and loss of the short (sold) spread.
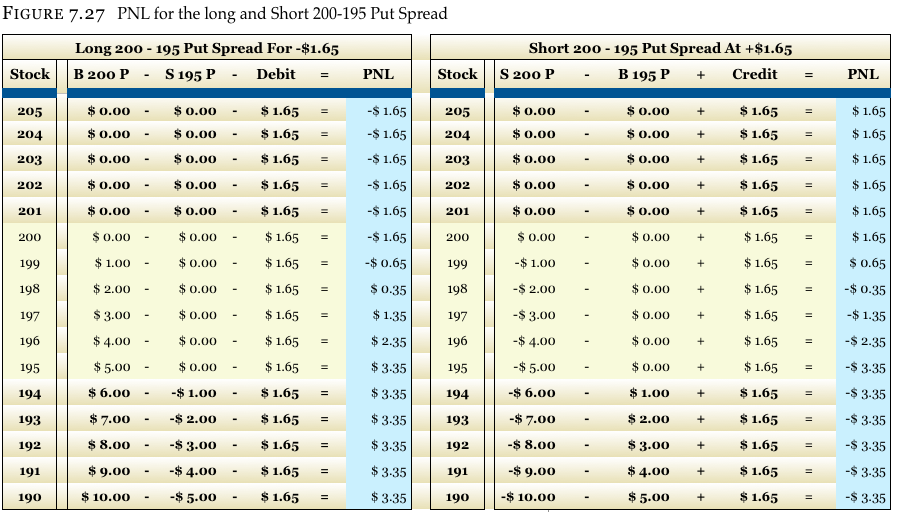
OCC
Figure 7.27 often helps people realize that, no matter what happens, your loss is offset by someone else’s profit and vice versa. At this point many people start to question, “Okay, say I have a huge winner but the other guy who lost money to me can’t afford to pay. How do I get my money?” This is not only a great question, but a practical one as well.
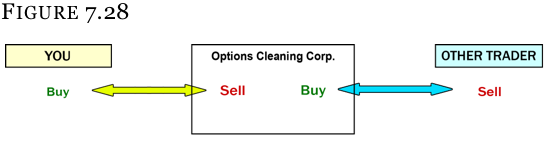
All option transactions go through something called the Options Clearing Corporation, or OCC. Their website is www.optionsclearing.com.
They are the guarantee of every option transaction, and some of the people responsible for setting margin requirements so that you are assured to collect what is coming to you (or pay what you owe). They literally take the other side of every transaction so that your trade will never have a problem. And even during the crash of 1987 and the banking crisis of 2007-2008, they were never even close to being insolvent. They have earned their AAA rating by being sound stewards of the marketplace and do not do any investing on their own.
So even if the person who did the trade with you cannot afford to pay you, the OCC will pay you immediately. You will not even know anything has changed. Then the OCC will be the ones to attempt to collect the monies from the other party. They, in theory, are standing between you and the other trader on every transaction.
To determine the break-even point on a put vertical, you calculate it the same way as the call, but instead of adding the cost of the spread, you will subtract it. This is done because we need the market to move lower (not higher like with the call spread) to gain intrinsic value.
Put Vertical Break-even = Closest to ATM strike – Spread Price
Using the put spread above we can calculate the break-even very easily. We use the 200 strike since it is the closest to ATM strike in the 200 – 195 put spread. Then, we simply subtract the cost of this spread, which is $1.65, from $200 to get a break-even of $198.35.
Anything below $198.35 is a profit to the buyer and a loss to the seller. The seller begins to make a profit at any stock price above $198.35.
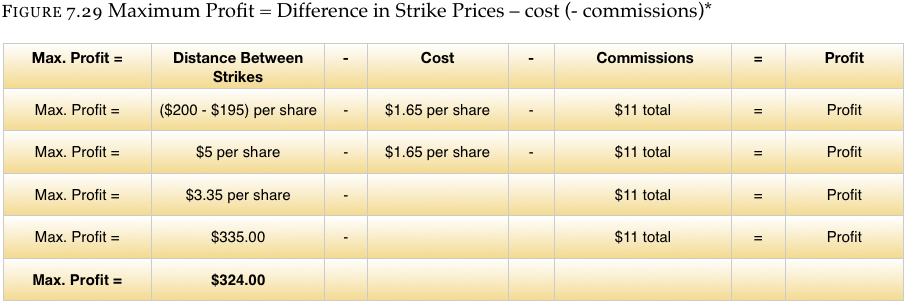
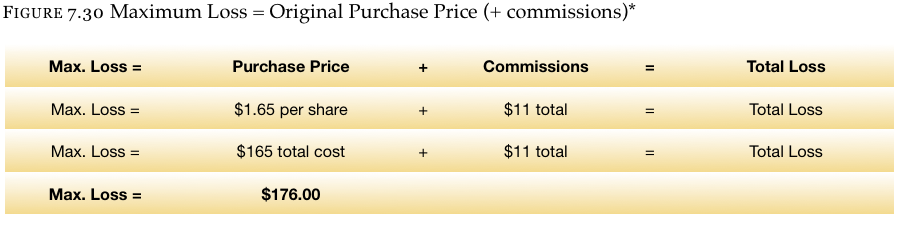
We already saw that the break-even points were calculated slightly differently from the call vertical spread, BUT the maximum profit and maximum loss are calculated exactly the same way. An example follows Figure 7.29.
* Don’t get confused here when you see “-” and “+” around the commissions. You will always be paying commissions on your trades. Brokers do not have a charitable side to them. We added negative and positive signs to symbolize how commissions work.
When you receive the maximum profit, commissions will be taken out, thus it has a negative sign associated with it.
When you experience the maximum loss, commissions will be added to the loss, thus it has a positive sign associated with it.
For illustrative purposes, we will simply state that the cost of commissions to buy and/or sell this spread is $11. Different brokerage firms have different commission schedules and rates.
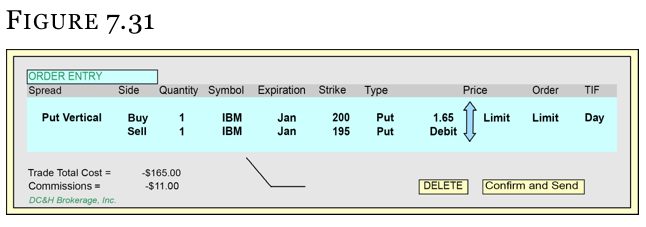
Order Example (Long Put Vertical Spread)
In Figure7.31, you will notice that the put vertical we have been discussing has been entered into the trading platform and is ready to send to the trading floor for execution. Please take further notice that the price of the spread is a $1.65 debit. This debit price is all that is entered – not the two individual options making up the spread.
Sometimes your trades will be lucky and only hindsight will tell you with certainty which ended up as the better trade – buying or selling the vertical. But after reading the criteria portion, you may decide that you want to learn towards selling a vertical spread instead of buying a vertical spread because of variables like high volatility levels.
We have found from a very informal survey of our colleagues both on and off the trading floor that many do NOT buy or sell vertical spreads for a directional bet. Rather, they use vertical spreads as the building blocks for more sophisticated trading strategies such as Broken-Wing Butterflies, Butterflies, Condor, Iron Condors, Boxes, Jelly Rolls, etc. Mastering vertical spreads will make learning every other option strategy much easier. Ignoring vertical spreads will make learning complicated strategies almost impossible.
Both buying and selling vertical spreads can be a profitable so we will provide a helpful refresher on the market opinions for each spread. Remember that there is buying a vertical call spread (bullish) and selling a vertical call spread (bearish). There is also buying a vertical put spread (bearish) and selling a vertical put spread (bullish).
![]()
Thus if we feel that the market is going to go higher, we can buy a bullish spread (long call spread) or sell a bearish spread (short put spread). The same holds true in reverse.
Both the long call and long put spread are most often used to take a directional bet. In other words, you believe that the stock is going to move in a particular direction and you want to place a trade with a good risk-to-reward ratio. Spending $3.87 on a spread that can be worth a maximum of $10 in the future sounds like a good bet to many.
If you think that the market might move in one direction, stay still, or even calm down from its current place, then you could employ a sale of a vertical spread. We touched on this previously, but another example will make this last statement more understandable.
With the stock at $201,we can make the argument that we feel the market is calming down. We are bullish on the market, but not enough to believe that the stock is going to run all the way up to $210 where we need it to go in order to make the maximum profit on a long call spread trade. Solution? Sell a put spread.
If you sell the 195-190 put spread at $1.01 per share ($2.43 195 put / $1.42 190 put), you are hoping the market closes above $195 and the buyer is hoping it closes below it. So with the stock starting at $201, we need the stock to stay where it is, go up, or not sell off too much. This is a huge advantage compared to the person who needs the stock to sell off below $190 to make the maximum profit.
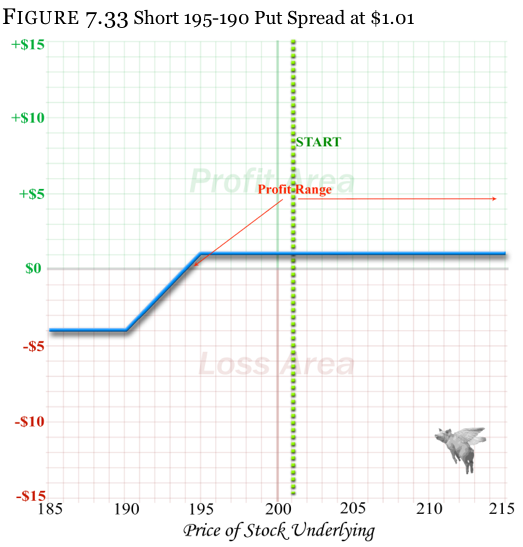
The same thing can be done with a short call spread for people who are slightly more bearish than bullish. Instead of selling the 195-190 put spread, we could sell an out-of-the-money call spread like the 205-210 short vertical at $1.48 ($2.81 and $1.33). In this instance, you would want the stock to go down (anywhere), stay flat, or just not go up above $205 (from $201 starting price). The graph for that trade would look as Figure7.34.
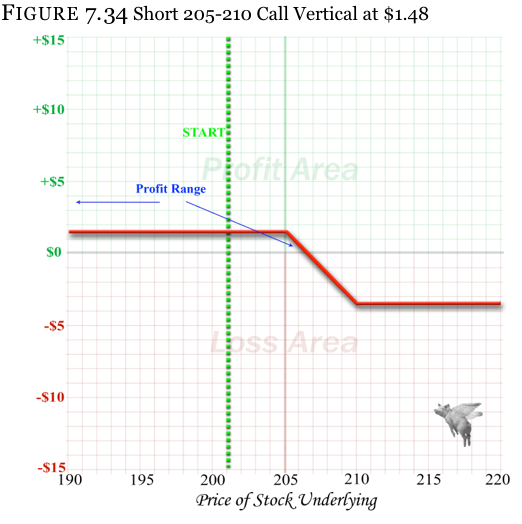
Further Study
After seeing both of these short vertical spreads, you might ask, “What if I think the market is going to stagnate? Can I sell both (call and put) verticals?” The answer is a resounding yes. This is what we were referring to when we stated that vertical spreads are the building blocks of more complicated trades that most market-makers prefer. The simultaneous sale of a call and a put spread is called an “iron condor” and is covered in the at-home study course, Essentials. This and the many other trades preferred by professional traders are obviously beyond the scope of a basic introductory course.
What about the short call or put being taken away?
First we have to learn two terms, and how they are defined.
Exercise – An early exercise is when the OWNER of the option elects to convert his LONG option into shares of stock prior to expiration.
Assignment – An assignment is when the SELLER of the option is forced to lose his SHORT option position and have shares (either long or short) put into his account.
When first learning option strategies, such as collars, time spreads, and vertical spreads, the new option trader will often get overly concerned about selling one option against another long option. Once the concept that buying an option gives the owner the right (but the not the obligation) to convert the option into physical shares, the other side of the coin becomes visible.
You start to realize that you are long and short an option in these various spread positions. You are comfortable with being long an option because nothing will happen unless you make the conscious decision to contact the broker and make it happen. In other words, you will not wake up one day and see actual shares of stock in the account unless you want them there.
But selling an option is a little trickier since the other person has control. When you sell an option you have no control over when the other person may want to exercise his right to buy (call) or sell (put) stock shares. You can then wake up one morning and find out that the owner of the option you sold has converted his option into stock and you now have a stock position even if it was protected.
If you sold a call, you will then have to sell shares of stock. Because the owner of the call has the right to buy stock, you have the obligation to sell stock.
If you sold a put, you will have the obligation to buy shares of stock. The owner of the put has the right to sell stock at any time, which mandates that you buy shares.
The put exercise is not nearly as large of a worry as the call exercise with stock options. The reason is not important right now and is the subject of more complicated texts (Option Professional available at RandomWalkTrading.com), but we will give you a quick answer. Most stocks pay a dividend, thus prior to a dividend being paid, the owner of the call will exercise the call to turn it into stock so that he can receive the dividend. No one is going to want to exercise a put and sell a share, thus being forced to pay the dividend. This is an oversimplified answer, but one that should suffice for your introduction to options.
What if you are assigned?
When first learning vertical spreads, many neophytes have the uneducated fear that they do not have control over the option they sell. They know that, when they buy an option, they can exercise it (or not) any time they choose. But if this is true for the option they buy, the opposite must be true for the option they sell and it is.
This is NOT a concern with most strategies that Random Walk teaches as we only instruct in risk averse positions, concepts, and strategies. With the positions we are teaching, like this vertical spread, you are always going to be protected.
As a matter of fact, when buying a vertical spread you will learn to absolutely love an assignment notice from your broker. The case study of a call spread will illustrate your first glimpse of assignment, what happens, and how you will actually end up with a free synthetic option.
Using the call spread as an example, we can illustrate what would happen after an assignment.
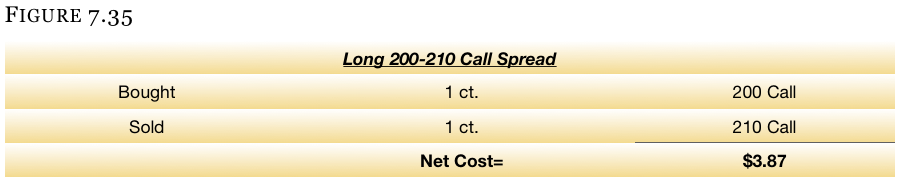
You sold the 210 strike call as part of the spread, which the buyer will not ever want to exercise until the stock runs above $210 (the strike price). There is no reason to exercise a call at the 210 strike and end up with long stock from $210 when the stock is trading at $207. It would be cheaper to simply buy the stock at $207 rather than buy it at $210 through exercising the call.
Thus the stock must be trading at a minimum of $210 per share. Also keep in mind that you are long the 200 strike call which will have an intrinsic value of $10 when the stock is at $210.
So let’s say the stock runs to $215 per share (from the starting price of $201). The calls will have intrinsic value as Figure7.36, plus some time value (not shown):
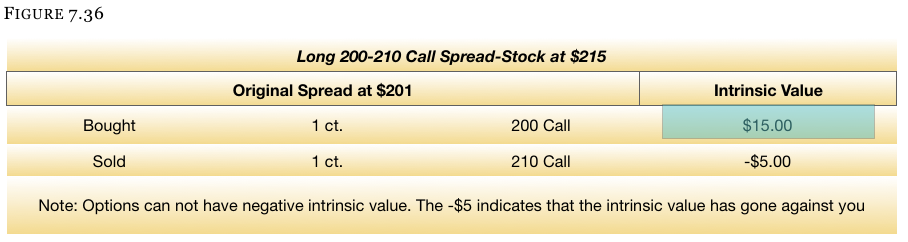
Timing
Exercises and Assignments can ONLY take place at the close of trading for the day. After the stock market closes at 3:00pm central time (4:00pm eastern time), people who want to exercise an option will notify their brokerage house of their intent. Well before the market opens the next morning, you will be notified of an exercise or assignment being completed and see an appropriate stock position in your account.
With our current spread, we would be assigned on the 210 strike call. Since a call gives the owner the right to purchase shares at the strike price, being the seller of the call will require you to sell short shares of stock at $210. The first time people see this in their account, they often panic. They see that they sold 100 shares (per contract) at $210 but the stock is $5 higher at $215. Again, don’t worry because you are long the 200 call that is still making money.
Yes, you will have lost $5 on the stock you sold at $210 when the stock is at $215, but you will be up at least $15 on the 200 strike calls you bought. A $15 profit and a (-$5) loss nets out to be $10. You have made $10 on the call spread, which is the maximum that can be made on a spread which is $10 wide.
Table of Long Call Vertical Spread PNL with/without Assignment
Figure 7.37 perfectly illustrates why there is never a need to worry about being assigned on an option when you are long a spread. The left side of the chart shows that, if you are assigned, you can NOT lose money no matter what happens to the stock between the assignment and expiration. The right side is the PNL of the spread that does not have an early exercise occurring prior to expiration so you can compare.
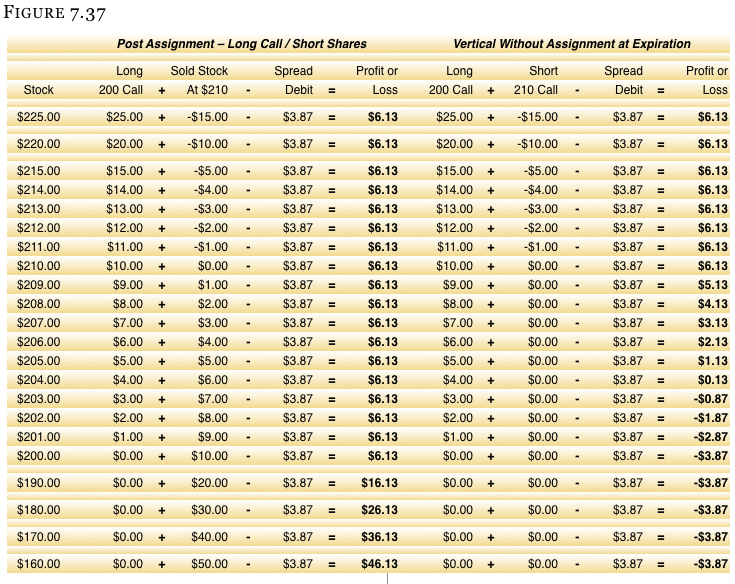
Free Synthetic Option
As a matter of fact, you will see on this call spread that our original desire was for the stock to increase in price (from $201 to above $210). Then once the assignment occurs, we made the maximum profit prior to expiration day, which you usually have to wait until expiration to receive the maximum profit. Then after the assignment, our opinion will change based on the resulting position. You will see that more money is made as the stock falls lower.
This is now acting almost like a long naked put position. As a matter of fact, it is acting exactly like a long naked put position, and the long call and short stock (by definition) is a synthetic long put. You have made the most you can from the original call spread and were given the profits PLUS a free long put. So when you first get an assignment notice, please avoid your instinct to panic and instead be happy that you were given a great opportunity.
Where did the other chapters go?
- Chapter 1: Stock
- Chapter 2: Options
- Chapter 3: Options in Action
- Chapter 4: The Greeks
- Chapter 5: Naked Options
- Chapter 6: Straddles & Strangles
- Chapter 7: Vertical Spreads
- Chapter 8: Vertical Spreads Criteria
- Chapter 9: Stock Protection
- Chapter 10: Shaving Bid-Ask Spread